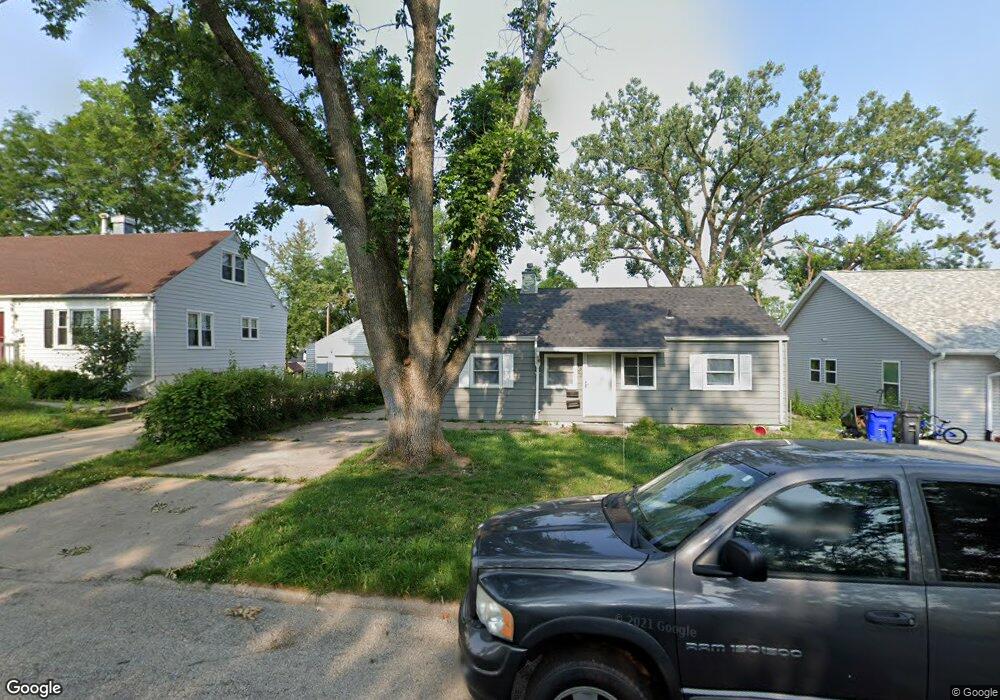
3820 Lennox Ave NE Cedar Rapids, IA 52402
Kenwood Park NeighborhoodEstimated Value: $142,000 - $152,000
3
Beds
1
Bath
864
Sq Ft
$170/Sq Ft
Est. Value
About This Home
This home is located at 3820 Lennox Ave NE, Cedar Rapids, IA 52402 and is currently estimated at $146,906, approximately $170 per square foot. 3820 Lennox Ave NE is a home located in Linn County with nearby schools including Kenwood Leadership Academy, Franklin Middle School, and George Washington High School.
Ownership History
Date
Name
Owned For
Owner Type
Purchase Details
Closed on
Jan 30, 2007
Sold by
Novey Stephen D and Novey Carol J
Bought by
Klith Herman and Klith Christine
Current Estimated Value
Home Financials for this Owner
Home Financials are based on the most recent Mortgage that was taken out on this home.
Original Mortgage
$70,800
Outstanding Balance
$42,547
Interest Rate
6.22%
Mortgage Type
Purchase Money Mortgage
Estimated Equity
$104,359
Purchase Details
Closed on
Dec 18, 2003
Sold by
Orourke Tonya A
Bought by
Novey Stephen D and Novey Carol J
Home Financials for this Owner
Home Financials are based on the most recent Mortgage that was taken out on this home.
Original Mortgage
$65,984
Interest Rate
5.75%
Mortgage Type
Unknown
Purchase Details
Closed on
Sep 19, 1998
Sold by
Hawkins Clarence C
Bought by
Orourke Tonya
Home Financials for this Owner
Home Financials are based on the most recent Mortgage that was taken out on this home.
Original Mortgage
$48,600
Interest Rate
6.98%
Mortgage Type
Assumption
Create a Home Valuation Report for This Property
The Home Valuation Report is an in-depth analysis detailing your home's value as well as a comparison with similar homes in the area
Home Values in the Area
Average Home Value in this Area
Purchase History
| Date | Buyer | Sale Price | Title Company |
|---|---|---|---|
| Klith Herman | $88,000 | None Available | |
| Novey Stephen D | $82,000 | -- | |
| Orourke Tonya | $53,500 | -- |
Source: Public Records
Mortgage History
| Date | Status | Borrower | Loan Amount |
|---|---|---|---|
| Open | Klith Herman | $70,800 | |
| Previous Owner | Novey Stephen D | $65,984 | |
| Previous Owner | Orourke Tonya | $48,600 |
Source: Public Records
Tax History Compared to Growth
Tax History
| Year | Tax Paid | Tax Assessment Tax Assessment Total Assessment is a certain percentage of the fair market value that is determined by local assessors to be the total taxable value of land and additions on the property. | Land | Improvement |
|---|---|---|---|---|
| 2025 | $2,252 | $129,500 | $34,100 | $95,400 |
| 2024 | $2,254 | $127,300 | $34,100 | $93,200 |
| 2023 | $2,254 | $127,300 | $34,100 | $93,200 |
| 2022 | $1,990 | $106,900 | $34,100 | $72,800 |
| 2021 | $2,022 | $96,100 | $27,300 | $68,800 |
| 2020 | $2,022 | $91,600 | $24,500 | $67,100 |
| 2019 | $1,820 | $84,400 | $21,800 | $62,600 |
| 2018 | $1,768 | $84,400 | $21,800 | $62,600 |
| 2017 | $1,740 | $81,900 | $21,800 | $60,100 |
| 2016 | $1,740 | $81,900 | $21,800 | $60,100 |
| 2015 | $1,732 | $81,434 | $21,816 | $59,618 |
| 2014 | $1,732 | $81,434 | $21,816 | $59,618 |
| 2013 | $1,696 | $81,434 | $21,816 | $59,618 |
Source: Public Records
Map
Nearby Homes
- 3817 Lennox Ave NE
- 143 40th St NE
- 727 37th St NE
- 3718 C Ave NE
- 3717 H Ave NE
- 615 34th St NE
- 628 33rd St NE
- 413 34th St NE
- 3322 C Ave NE
- 1032 34th St NE
- 1114 35th St NE
- 419 33rd St NE
- 0 C Ave NE
- 410 32nd St NE
- 1231 Miami Ct NE
- 1101 Dover St NE
- 1129 Clifton St NE
- 1236 Miami Ct NE
- 3107 E Ave NE
- 1134 Center St NE
- 3824 Lennox Ave NE
- 3814 Lennox Ave NE
- 3828 Lennox Ave NE
- 3800 Lennox Ave NE
- 3817 F Ave NE
- 3834 Lennox Ave NE
- 3813 F Ave NE
- 3825 F Ave NE
- 642 38th St NE
- 3821 Lennox Ave NE
- 3825 Lennox Ave NE
- 3831 F Ave NE
- 3811 Lennox Ave NE
- 3831 Lennox Ave NE
- 3840 Lennox Ave NE
- 622 38th St NE
- 648 38th St NE
- 3839 Lennox Ave NE
- 641 39th St NE
- 616 38th St NE