Estimated Value: $601,000 - $928,000
--
Bed
--
Bath
2,384
Sq Ft
$304/Sq Ft
Est. Value
About This Home
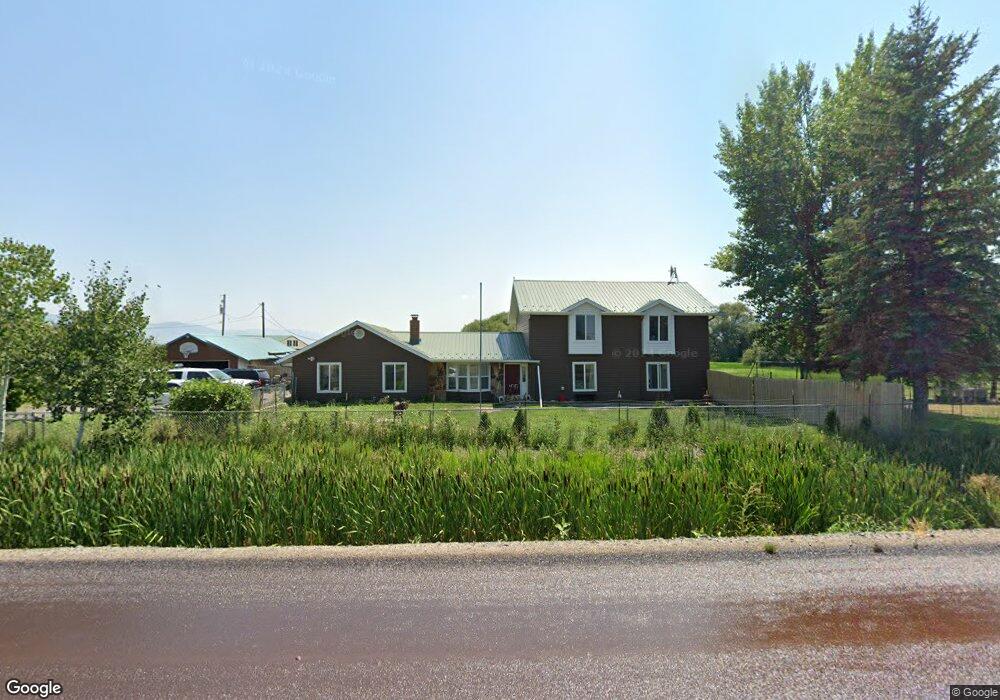
This home is located at 3820 W 600 S, Logan, UT 84321 and is currently estimated at $725,050, approximately $304 per square foot. 3820 W 600 S is a home with nearby schools including Mountainside School, South Cache Middle School, and Mountain Crest High School.
Ownership History
Date
Name
Owned For
Owner Type
Purchase Details
Closed on
Sep 25, 2020
Sold by
Ribera James R and Ribera Brandi L
Bought by
Ribera James and Ribera Brandi L
Current Estimated Value
Home Financials for this Owner
Home Financials are based on the most recent Mortgage that was taken out on this home.
Original Mortgage
$333,750
Outstanding Balance
$295,508
Interest Rate
2.9%
Mortgage Type
New Conventional
Estimated Equity
$429,542
Purchase Details
Closed on
Jul 6, 2018
Sold by
Ribera John E and Ribera Ann Lee
Bought by
Ribera James R and Ribera Brandi L
Home Financials for this Owner
Home Financials are based on the most recent Mortgage that was taken out on this home.
Original Mortgage
$265,676
Interest Rate
4.6%
Mortgage Type
New Conventional
Purchase Details
Closed on
Sep 26, 2012
Sold by
Ribera John E and Ribera Ann L
Bought by
Ribera John E and Ribera Ann Lee
Create a Home Valuation Report for This Property
The Home Valuation Report is an in-depth analysis detailing your home's value as well as a comparison with similar homes in the area
Home Values in the Area
Average Home Value in this Area
Purchase History
| Date | Buyer | Sale Price | Title Company |
|---|---|---|---|
| Ribera James | -- | American Secure Title Logan | |
| Ribera James R | -- | Cache Title Company Inc | |
| Ribera John E | -- | None Available |
Source: Public Records
Mortgage History
| Date | Status | Borrower | Loan Amount |
|---|---|---|---|
| Open | Ribera James | $333,750 | |
| Previous Owner | Ribera James R | $265,676 |
Source: Public Records
Tax History Compared to Growth
Tax History
| Year | Tax Paid | Tax Assessment Tax Assessment Total Assessment is a certain percentage of the fair market value that is determined by local assessors to be the total taxable value of land and additions on the property. | Land | Improvement |
|---|---|---|---|---|
| 2025 | $2,085 | $335,900 | $0 | $0 |
| 2024 | $2,254 | $335,900 | $0 | $0 |
| 2023 | $2,390 | $333,455 | $0 | $0 |
| 2022 | $2,499 | $333,450 | $0 | $0 |
| 2021 | $2,116 | $403,160 | $107,840 | $295,320 |
| 2020 | $1,981 | $353,940 | $107,840 | $246,100 |
| 2019 | $1,904 | $314,912 | $107,840 | $207,072 |
| 2018 | $1,786 | $284,088 | $107,840 | $176,248 |
| 2013 | -- | $133,005 | $0 | $0 |
Source: Public Records
Map
Nearby Homes
- 3703 W 600 S
- 2400 S 2800 W
- 515 S 1215 W
- 527 S 1215 W
- 518 N 220 E
- 203 E 600 N
- 5800 W 1800 S
- 6044 W 1800 S
- 1200 S 5400 W Unit 13
- 521 S 1215 W
- 509 S 1215 W
- 518 S 1255 W
- 512 S 1255 W
- 1790 W 620 S
- 848 N 100 E Unit 73
- 535 Pheaant Hollow Ln
- 679 Trail Cir
- Redwood Plan at Rivergate - Logan
- Madison Plan at Rivergate - Logan
- Sitka Plan at Sugar Creek - Logan (Townhomes)