3821 3rd St Des Moines, IA 50313
Highland Park NeighborhoodEstimated Value: $130,000 - $149,000
2
Beds
1
Bath
822
Sq Ft
$167/Sq Ft
Est. Value
About This Home
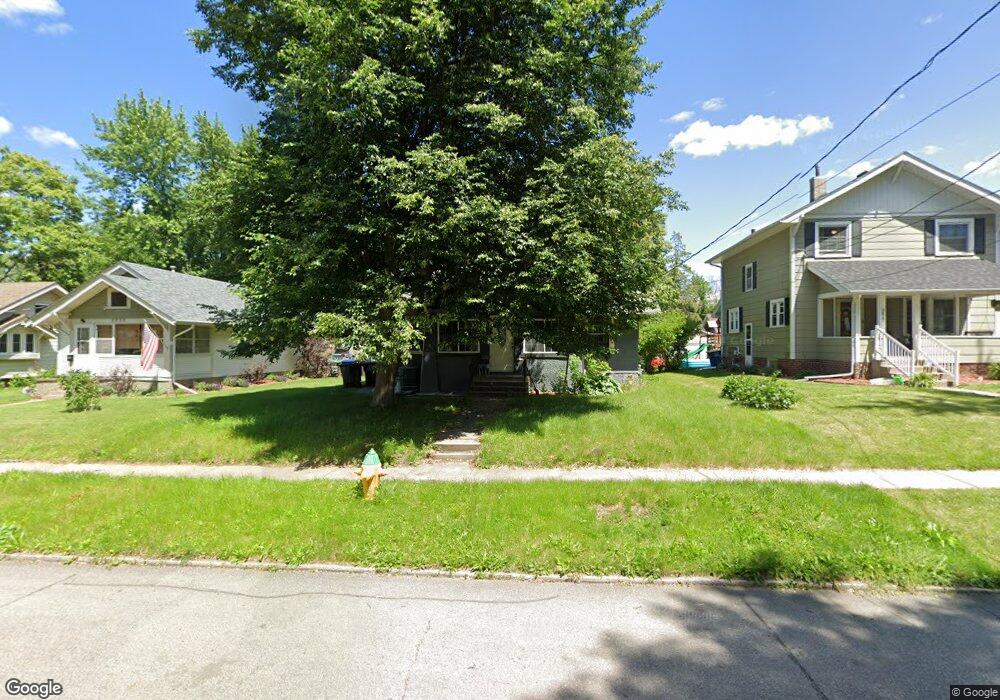
This home is located at 3821 3rd St, Des Moines, IA 50313 and is currently estimated at $137,100, approximately $166 per square foot. 3821 3rd St is a home located in Polk County with nearby schools including Oak Park Elementary School, Harding Middle School, and North High School.
Ownership History
Date
Name
Owned For
Owner Type
Purchase Details
Closed on
Nov 14, 2016
Sold by
Stennes Joyce
Bought by
Ginn Ricky L
Current Estimated Value
Purchase Details
Closed on
Nov 13, 2006
Sold by
Vanboord Adriaan
Bought by
Coleman William J
Create a Home Valuation Report for This Property
The Home Valuation Report is an in-depth analysis detailing your home's value as well as a comparison with similar homes in the area
Home Values in the Area
Average Home Value in this Area
Purchase History
| Date | Buyer | Sale Price | Title Company |
|---|---|---|---|
| Ginn Ricky L | $31,000 | Declaration Field | |
| Coleman William J | -- | None Available |
Source: Public Records
Tax History Compared to Growth
Tax History
| Year | Tax Paid | Tax Assessment Tax Assessment Total Assessment is a certain percentage of the fair market value that is determined by local assessors to be the total taxable value of land and additions on the property. | Land | Improvement |
|---|---|---|---|---|
| 2025 | $2,022 | $118,500 | $28,900 | $89,600 |
| 2024 | $2,022 | $102,800 | $25,100 | $77,700 |
| 2023 | $1,996 | $102,800 | $25,100 | $77,700 |
| 2022 | $1,982 | $84,700 | $21,200 | $63,500 |
| 2021 | $1,874 | $84,700 | $21,200 | $63,500 |
| 2020 | $1,946 | $75,100 | $19,000 | $56,100 |
| 2019 | $1,862 | $75,100 | $19,000 | $56,100 |
| 2018 | $1,844 | $69,300 | $17,300 | $52,000 |
| 2017 | $1,458 | $69,300 | $17,300 | $52,000 |
| 2016 | $1,414 | $62,400 | $15,500 | $46,900 |
| 2015 | $1,414 | $62,400 | $15,500 | $46,900 |
| 2014 | $1,238 | $57,300 | $15,500 | $41,800 |
Source: Public Records
Map
Nearby Homes