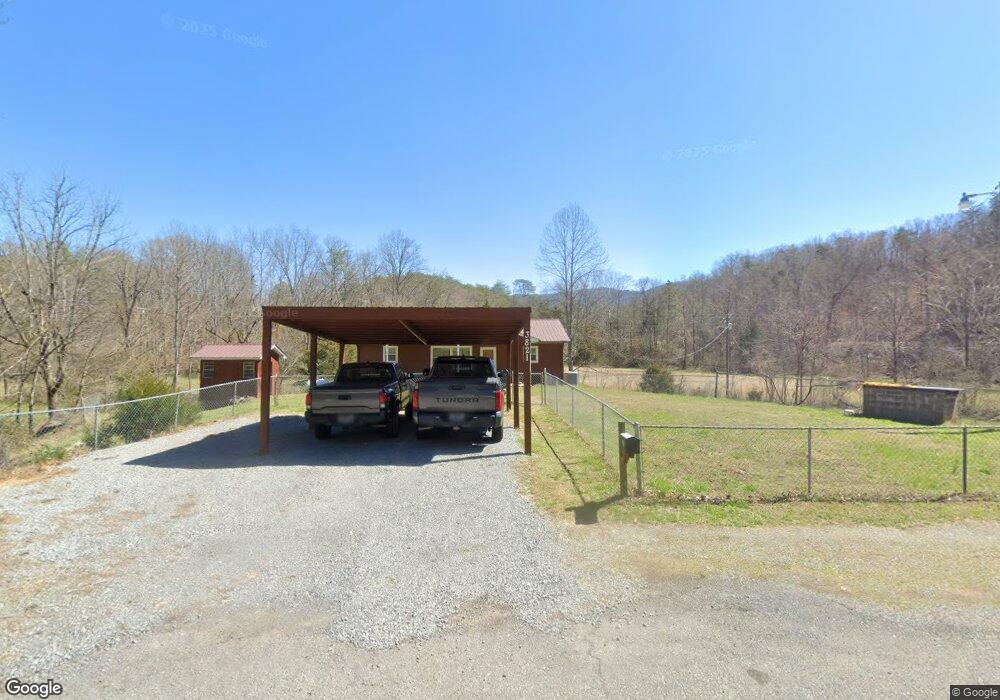
3821 Allegheny Loop Rd Maryville, TN 37803
Lanier NeighborhoodEstimated Value: $300,000 - $599,000
--
Bed
1
Bath
1,320
Sq Ft
$299/Sq Ft
Est. Value
About This Home
This home is located at 3821 Allegheny Loop Rd, Maryville, TN 37803 and is currently estimated at $394,781, approximately $299 per square foot. 3821 Allegheny Loop Rd is a home located in Blount County with nearby schools including Lanier Elementary School, Carpenters Middle School, and William Blount High School.
Ownership History
Date
Name
Owned For
Owner Type
Purchase Details
Closed on
Apr 7, 2016
Sold by
Sterling Charles H
Bought by
Caudill Charles E
Current Estimated Value
Purchase Details
Closed on
Dec 19, 2012
Sold by
Caudill Charles E
Bought by
Caudill Charles E
Purchase Details
Closed on
Dec 12, 2006
Sold by
Cummings Steven Lynn
Bought by
Caudill Charles Edward
Purchase Details
Closed on
Jul 29, 2005
Sold by
Steven Cummings L
Bought by
Caudill Charles E
Home Financials for this Owner
Home Financials are based on the most recent Mortgage that was taken out on this home.
Original Mortgage
$100,000
Interest Rate
5.48%
Purchase Details
Closed on
Jan 1, 1986
Bought by
Cummings Steven Lynn and Sandra Kay
Create a Home Valuation Report for This Property
The Home Valuation Report is an in-depth analysis detailing your home's value as well as a comparison with similar homes in the area
Home Values in the Area
Average Home Value in this Area
Purchase History
| Date | Buyer | Sale Price | Title Company |
|---|---|---|---|
| Caudill Charles E | -- | -- | |
| Caudill Charles E | -- | -- | |
| Caudill Charles E | -- | -- | |
| Caudill Charles Edward | $20,000 | -- | |
| Caudill Charles E | $125,000 | -- | |
| Cummings Steven Lynn | $42,000 | -- |
Source: Public Records
Mortgage History
| Date | Status | Borrower | Loan Amount |
|---|---|---|---|
| Previous Owner | Cummings Steven Lynn | $100,000 |
Source: Public Records
Tax History Compared to Growth
Tax History
| Year | Tax Paid | Tax Assessment Tax Assessment Total Assessment is a certain percentage of the fair market value that is determined by local assessors to be the total taxable value of land and additions on the property. | Land | Improvement |
|---|---|---|---|---|
| 2025 | $923 | $58,075 | $0 | $0 |
| 2024 | $923 | $58,075 | $18,650 | $39,425 |
| 2023 | $923 | $58,075 | $18,650 | $39,425 |
| 2022 | $671 | $27,175 | $12,400 | $14,775 |
| 2021 | $671 | $27,175 | $12,400 | $14,775 |
| 2020 | $671 | $27,175 | $12,400 | $14,775 |
| 2019 | $671 | $27,175 | $12,400 | $14,775 |
| 2018 | $693 | $28,075 | $10,975 | $17,100 |
| 2017 | $693 | $28,075 | $10,975 | $17,100 |
| 2016 | $584 | $23,650 | $6,550 | $17,100 |
| 2015 | $508 | $23,650 | $6,550 | $17,100 |
| 2014 | $532 | $23,650 | $6,550 | $17,100 |
| 2013 | $532 | $24,725 | $0 | $0 |
Source: Public Records
Map
Nearby Homes
- 4705 Emert Williams Rd
- 4913 Stump Rd
- 3940 Allegheny Loop Rd
- 3136 Allegheny Loop Rd
- 4893 Allegheny Cove Way
- 4536 6 Mile Rd
- 4540 6 Mile Rd
- 5027 Allegheny Cove Way
- 0 Mullins Way
- 2939 Calderwood Hwy
- 7134 Brewer Rd
- 1403 Chickadee Cir
- 7249 Brewer Rd
- 1367 Warrior Path
- 5812 Indian Warpath Rd
- 2419 Robin Ridge Dr
- 6039 Lindrick Ln
- 00 Calderwood Hwy
- 3646 Woodcove Cir
- 6051 Lindrick Ln
- 4769 Gribble Rd
- 3741 Allegheny Loop Rd
- 3737 Allegheny Loop Rd Unit 3739
- 4827 Stump Rd
- 3917 Allegheny Loop Rd
- 3917 Allegheny
- 4731 Gribble Rd
- 4901 Stump Rd
- 3704 Allegheny Loop Rd
- 4661 Emert Williams Rd
- 4008 Allegheny Loop Rd
- 4652 Emert Williams Rd
- 3641 Allegheny Loop Rd
- 4012 Allegheny Loop Rd
- 4646 Emert Williams Rd
- 4645 Emert Williams Rd
- 4619 Gribble Rd
- 4702 Gribble Rd
- 0 Emert Williams Rd
- 0 Stump