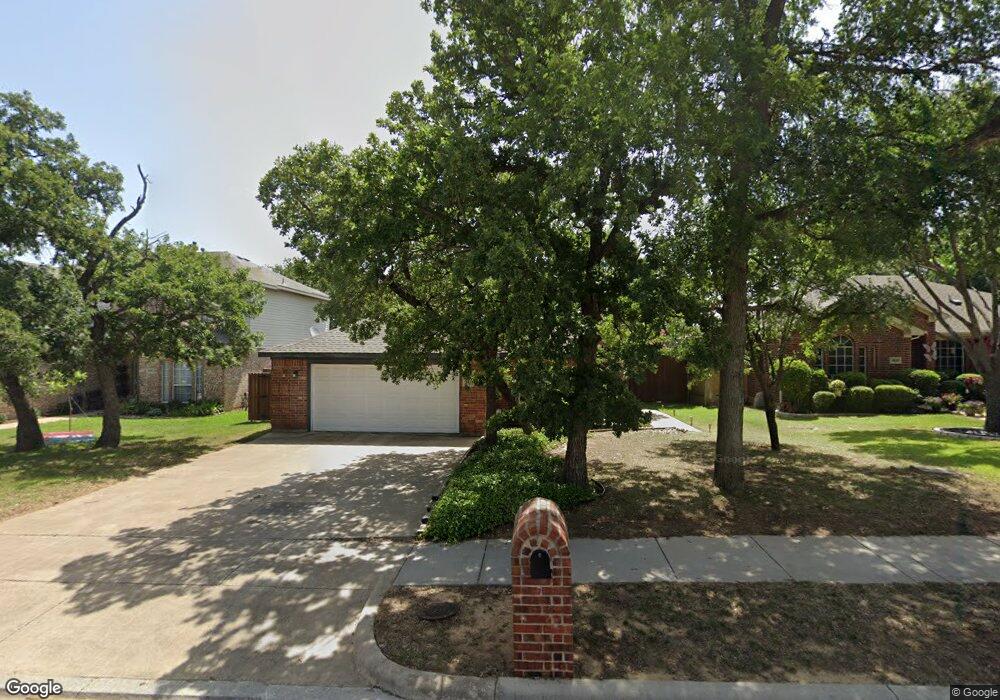
3821 Kirby Dr Denton, TX 76210
South Denton NeighborhoodEstimated Value: $330,000 - $344,000
4
Beds
3
Baths
1,760
Sq Ft
$192/Sq Ft
Est. Value
About This Home
This home is located at 3821 Kirby Dr, Denton, TX 76210 and is currently estimated at $337,114, approximately $191 per square foot. 3821 Kirby Dr is a home located in Denton County with nearby schools including Nelson Elementary School, McMath Middle School, and Denton High School.
Ownership History
Date
Name
Owned For
Owner Type
Purchase Details
Closed on
Aug 22, 2011
Sold by
Soda Chris
Bought by
Wilson Ashley N
Current Estimated Value
Purchase Details
Closed on
Mar 30, 2007
Sold by
Burrow Tammy and Cooper Michael
Bought by
Soda Christopher R and Wilson Ashley N
Home Financials for this Owner
Home Financials are based on the most recent Mortgage that was taken out on this home.
Original Mortgage
$137,750
Interest Rate
6.24%
Mortgage Type
Purchase Money Mortgage
Purchase Details
Closed on
Nov 16, 2001
Sold by
Choice Homes Inc
Bought by
Cooper Michael and Burrow Tammy
Home Financials for this Owner
Home Financials are based on the most recent Mortgage that was taken out on this home.
Original Mortgage
$135,865
Interest Rate
6.59%
Mortgage Type
FHA
Create a Home Valuation Report for This Property
The Home Valuation Report is an in-depth analysis detailing your home's value as well as a comparison with similar homes in the area
Home Values in the Area
Average Home Value in this Area
Purchase History
| Date | Buyer | Sale Price | Title Company |
|---|---|---|---|
| Wilson Ashley N | -- | None Available | |
| Soda Christopher R | -- | None Available | |
| Cooper Michael | -- | -- | |
| Cooper Michael | -- | -- |
Source: Public Records
Mortgage History
| Date | Status | Borrower | Loan Amount |
|---|---|---|---|
| Previous Owner | Soda Christopher R | $137,750 | |
| Previous Owner | Cooper Michael | $135,865 |
Source: Public Records
Tax History Compared to Growth
Tax History
| Year | Tax Paid | Tax Assessment Tax Assessment Total Assessment is a certain percentage of the fair market value that is determined by local assessors to be the total taxable value of land and additions on the property. | Land | Improvement |
|---|---|---|---|---|
| 2025 | $2,135 | $331,532 | $80,619 | $250,913 |
| 2024 | $6,260 | $324,300 | $0 | $0 |
| 2023 | $2,139 | $294,818 | $80,619 | $256,193 |
| 2022 | $5,690 | $268,016 | $63,565 | $204,451 |
| 2021 | $5,462 | $248,876 | $43,410 | $205,466 |
| 2020 | $5,106 | $223,364 | $43,410 | $179,954 |
| 2019 | $5,228 | $219,102 | $43,410 | $177,567 |
| 2018 | $4,812 | $199,184 | $43,410 | $155,774 |
| 2017 | $4,677 | $189,226 | $37,209 | $152,017 |
| 2016 | $4,571 | $176,312 | $37,209 | $139,103 |
| 2015 | $3,664 | $156,838 | $37,209 | $119,629 |
| 2013 | -- | $128,541 | $37,209 | $91,332 |
Source: Public Records
Map
Nearby Homes
- 2713 Hilcroft Ave
- 2617 Bissonet Dr
- 2804 Hollow Ridge Dr
- 2616 Hilcroft Ave
- 2817 Hereford Rd
- 2617 Hollow Ridge Dr
- 3448 Tuscan Hills Cir
- 3000 Bella Lago Dr
- 2617 Hereford Rd
- 2721 Arabian Ave
- 3428 Tuscan Hills Cir
- 3900 Gessner Dr
- 2913 Montebello Dr
- 2917 Montebello Dr
- 3009 Montebello Dr
- 2601 Pinto Dr
- 2713 Clubhouse Dr
- 3713 Syracuse Dr
- 3237 Clydesdale Dr
- 3705 Miramar Dr
- 3825 Kirby Dr
- 3817 Kirby Dr
- 3813 Kirby Dr
- 3829 Kirby Dr
- 3809 Kirby Dr
- 3820 Kirby Dr
- 3833 Kirby Dr
- 3824 Kirby Dr
- 2825 San Felipe Dr
- 3828 Kirby Dr
- 3805 Kirby Dr
- 3837 Kirby Dr
- 2821 San Felipe Dr
- 3832 Kirby Dr
- 2824 Bissonet Dr
- 2817 San Felipe Dr
- 3821 Chimney Rock Dr
- 3841 Kirby Dr
- 3825 Chimney Rock Dr
- 3836 Kirby Dr