Estimated Value: $502,000 - $532,000
4
Beds
3
Baths
2,164
Sq Ft
$238/Sq Ft
Est. Value
About This Home
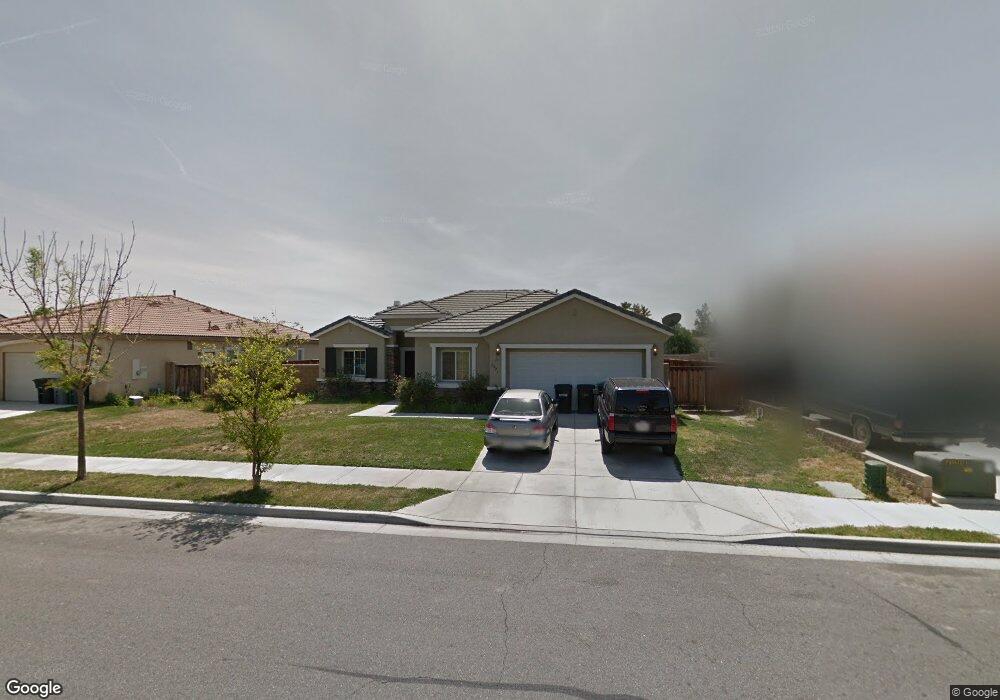
This home is located at 3821 Serenity St, Hemet, CA 92545 and is currently estimated at $514,496, approximately $237 per square foot. 3821 Serenity St is a home located in Riverside County with nearby schools including Cawston Elementary School, Rancho Viejo Middle School, and Tahquitz High School.
Ownership History
Date
Name
Owned For
Owner Type
Purchase Details
Closed on
Mar 23, 2009
Sold by
Martinez Diana
Bought by
Carrillo Juan J
Current Estimated Value
Purchase Details
Closed on
Jan 21, 2009
Sold by
Hsbc Bank Usa National Association
Bought by
Carrillo Juan J
Home Financials for this Owner
Home Financials are based on the most recent Mortgage that was taken out on this home.
Original Mortgage
$173,302
Interest Rate
5.04%
Mortgage Type
FHA
Purchase Details
Closed on
Oct 29, 2008
Sold by
Mcbride Owen Charles and Mcbride Jean Marie
Bought by
Hsbc Bank Usa National Association and Naac 2007-2
Purchase Details
Closed on
Nov 9, 2006
Sold by
Hemet/San Jacinto Ventures Llc
Bought by
Mcbride Owen Charles and Mcbride Jean Marie
Home Financials for this Owner
Home Financials are based on the most recent Mortgage that was taken out on this home.
Original Mortgage
$325,750
Interest Rate
6.16%
Mortgage Type
Purchase Money Mortgage
Create a Home Valuation Report for This Property
The Home Valuation Report is an in-depth analysis detailing your home's value as well as a comparison with similar homes in the area
Home Values in the Area
Average Home Value in this Area
Purchase History
| Date | Buyer | Sale Price | Title Company |
|---|---|---|---|
| Carrillo Juan J | -- | First American Ttile Company | |
| Carrillo Juan J | $176,500 | First American Title Company | |
| Hsbc Bank Usa National Association | $345,743 | None Available | |
| Mcbride Owen Charles | $407,500 | Chicago Title Company |
Source: Public Records
Mortgage History
| Date | Status | Borrower | Loan Amount |
|---|---|---|---|
| Previous Owner | Carrillo Juan J | $173,302 | |
| Previous Owner | Mcbride Owen Charles | $325,750 |
Source: Public Records
Tax History Compared to Growth
Tax History
| Year | Tax Paid | Tax Assessment Tax Assessment Total Assessment is a certain percentage of the fair market value that is determined by local assessors to be the total taxable value of land and additions on the property. | Land | Improvement |
|---|---|---|---|---|
| 2025 | $5,402 | $227,270 | $51,502 | $175,768 |
| 2023 | $5,402 | $218,447 | $49,503 | $168,944 |
| 2022 | $5,113 | $214,165 | $48,533 | $165,632 |
| 2021 | $5,014 | $209,967 | $47,582 | $162,385 |
| 2020 | $4,925 | $207,815 | $47,095 | $160,720 |
| 2019 | $5,063 | $203,741 | $46,172 | $157,569 |
| 2018 | $4,693 | $199,747 | $45,267 | $154,480 |
| 2017 | $4,607 | $195,831 | $44,380 | $151,451 |
| 2016 | $4,532 | $191,992 | $43,510 | $148,482 |
| 2015 | $4,482 | $189,109 | $42,857 | $146,252 |
| 2014 | $4,336 | $185,406 | $42,018 | $143,388 |
Source: Public Records
Map
Nearby Homes
- 860 Provance St
- 766 Conlon Dr
- 669 Liverpool St
- 3831 Wild Sienna Trail
- 3807 Seattle St
- 4190 Annatto Ln
- 986 Coriander Dr Unit 304
- 508 Louisville St
- 3455 Sugar Maple Ct
- 3671 Sydney St
- 1048 Paintbrush Trail
- 1060 Saltbush Ln
- 442 Stockholm Ct
- 831 Coriander Dr Unit 405
- 1053 Indiangrass Dr
- 3727 Anchorage St
- 759 Via Linda Dr
- 411 N Sanderson Ave
- 372 Via Capri
- 766 Via Casitas Dr
- 3841 Serenity St
- 3791 Serenity St
- 3761 Serenity St
- 3871 Serenity St
- 733 Reisling St
- 736 Provance St
- 3817 W Menlo Ave
- 3793 W Menlo Ave
- 3731 Serenity St
- 715 Provance St
- 732 Reisling St
- 3843 W Menlo Ave
- 743 Reisling St
- 3767 W Menlo Ave
- 744 Provance St
- 725 Provance St
- 3867 W Menlo Ave
- 742 Riesling St
- 3743 W Menlo Ave
- 742 Reisling St