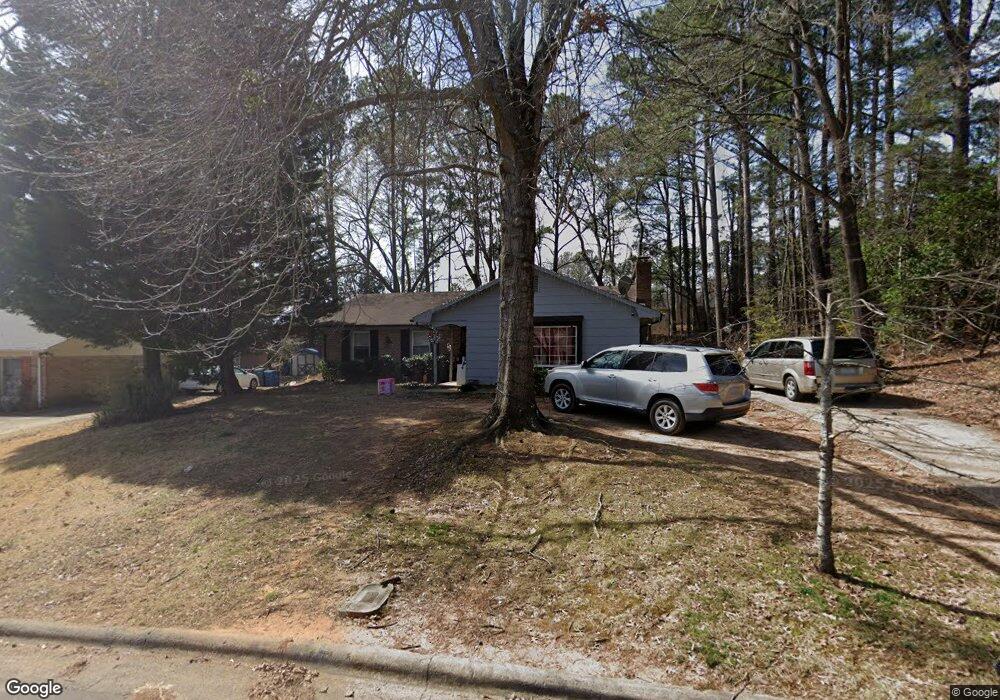
3821 Townsend St Durham, NC 27704
Duke Homestead NeighborhoodEstimated Value: $302,737 - $343,000
3
Beds
2
Baths
1,371
Sq Ft
$230/Sq Ft
Est. Value
About This Home
This home is located at 3821 Townsend St, Durham, NC 27704 and is currently estimated at $315,934, approximately $230 per square foot. 3821 Townsend St is a home located in Durham County with nearby schools including Holt Elementary, George L Carrington Middle, and Northern High School.
Ownership History
Date
Name
Owned For
Owner Type
Purchase Details
Closed on
Dec 21, 2020
Sold by
Hinton Jennifer and Hinton Roy
Bought by
Hughes David Lewis and Hughes Mikacla Dawn
Current Estimated Value
Home Financials for this Owner
Home Financials are based on the most recent Mortgage that was taken out on this home.
Original Mortgage
$140,000
Outstanding Balance
$124,864
Interest Rate
2.8%
Mortgage Type
New Conventional
Estimated Equity
$191,070
Purchase Details
Closed on
Jul 10, 2017
Sold by
Lemons Robert S
Bought by
Lemons Jennifer
Home Financials for this Owner
Home Financials are based on the most recent Mortgage that was taken out on this home.
Original Mortgage
$122,800
Interest Rate
3.88%
Mortgage Type
New Conventional
Purchase Details
Closed on
May 8, 2013
Sold by
Lemons Robert S
Bought by
Lemons Robert S and Lemons Jennifer
Home Financials for this Owner
Home Financials are based on the most recent Mortgage that was taken out on this home.
Original Mortgage
$127,368
Interest Rate
3.59%
Mortgage Type
VA
Create a Home Valuation Report for This Property
The Home Valuation Report is an in-depth analysis detailing your home's value as well as a comparison with similar homes in the area
Home Values in the Area
Average Home Value in this Area
Purchase History
| Date | Buyer | Sale Price | Title Company |
|---|---|---|---|
| Hughes David Lewis | $175,000 | None Available | |
| Lemons Jennifer | -- | None Available | |
| Lemons Robert S | -- | None Available |
Source: Public Records
Mortgage History
| Date | Status | Borrower | Loan Amount |
|---|---|---|---|
| Open | Hughes David Lewis | $140,000 | |
| Previous Owner | Lemons Jennifer | $122,800 | |
| Previous Owner | Lemons Robert S | $127,368 |
Source: Public Records
Tax History
| Year | Tax Paid | Tax Assessment Tax Assessment Total Assessment is a certain percentage of the fair market value that is determined by local assessors to be the total taxable value of land and additions on the property. | Land | Improvement |
|---|---|---|---|---|
| 2025 | $2,881 | $290,677 | $116,100 | $174,577 |
| 2024 | $2,213 | $158,649 | $38,700 | $119,949 |
| 2023 | $2,078 | $158,649 | $38,700 | $119,949 |
| 2022 | $2,031 | $158,649 | $38,700 | $119,949 |
| 2021 | $2,021 | $158,649 | $38,700 | $119,949 |
| 2020 | $1,973 | $158,649 | $38,700 | $119,949 |
| 2019 | $1,973 | $158,649 | $38,700 | $119,949 |
| 2018 | $1,657 | $122,125 | $25,800 | $96,325 |
| 2017 | $1,644 | $122,125 | $25,800 | $96,325 |
| 2016 | $1,589 | $122,125 | $25,800 | $96,325 |
| 2015 | $1,783 | $128,767 | $26,423 | $102,344 |
| 2014 | $1,783 | $128,767 | $26,423 | $102,344 |
Source: Public Records
Map
Nearby Homes
- 1011 Wyldewood Rd
- 1206A River Rock Dr
- 1419 Cherrycrest Dr
- 2207 Elk River Dr
- 1421 Cherrycrest Dr
- 1425 Cherrycrest Dr
- 1427 Cherrycrest Dr
- 812 Chalk Level Rd
- 11 Sweetbay Ct
- 812 Sanderson Dr
- 4123 Casa St
- 6 McBenson Place
- 805 Northwood Hills Ave
- 1 Signet Dr Unit A17
- 1918 Peppertree St
- 12 Patriot Cir
- 4208 Convergence St
- 13 Patriot Cir
- 1904 Stadium Dr
- 3256 Cascade Ln
- 3817 Townsend St
- 2414-A Stadium
- 1205 Wyldewood Rd
- 1201 Wyldewood Rd
- 2420 Stadium Dr Unit E
- 2420 Stadium Dr
- 2420 Stadium Dr
- 2420 Stadium Dr
- 2420 Stadium Dr
- 2420 Stadium Dr
- 2420 Stadium Dr
- 2420 Stadium Dr Unit F
- 2420 Stadium Dr Unit C
- 2420 Stadium Dr Unit D
- 2420 Stadium Dr Unit D
- 2420 Stadium Dr Unit B
- 2420 Stadium Dr Unit C
- 2420 Stadium Dr Unit A
- 2414 Stadium Dr Unit E
- 2414 Stadium Dr
Your Personal Tour Guide
Ask me questions while you tour the home.