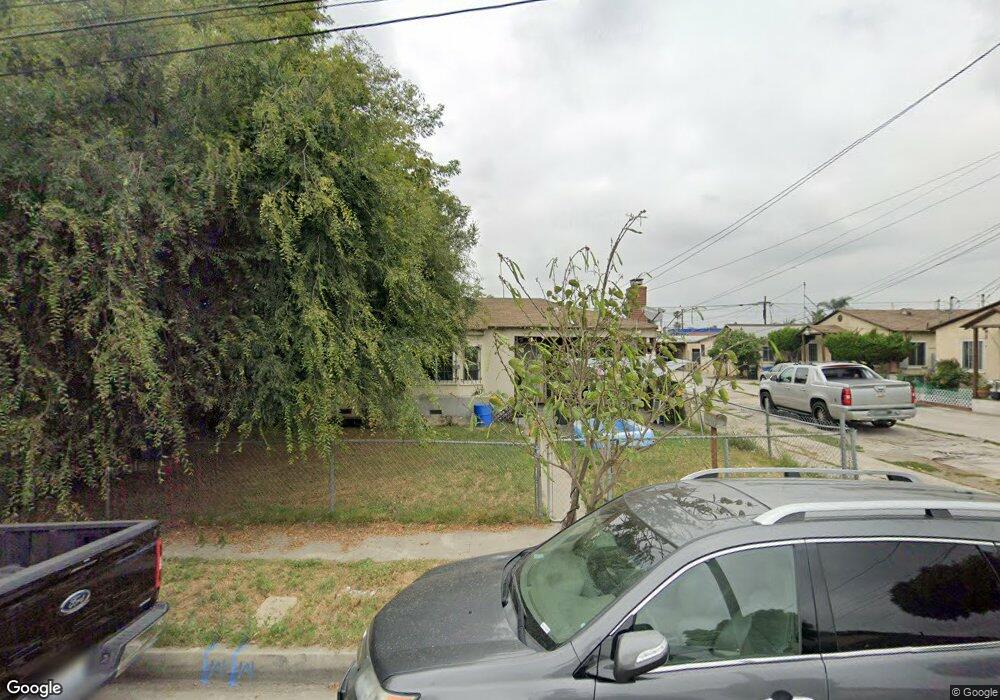
3821 W 108th St Inglewood, CA 90303
South Inglewood NeighborhoodEstimated Value: $825,000 - $930,000
5
Beds
2
Baths
1,996
Sq Ft
$444/Sq Ft
Est. Value
About This Home
This home is located at 3821 W 108th St, Inglewood, CA 90303 and is currently estimated at $886,089, approximately $443 per square foot. 3821 W 108th St is a home located in Los Angeles County with nearby schools including Worthington Elementary School, Monroe (Albert F.) Middle School, and Morningside High School.
Ownership History
Date
Name
Owned For
Owner Type
Purchase Details
Closed on
Nov 11, 2024
Sold by
Doris Feldman Benezra Living Trust and Benezra Doris Feldman
Bought by
Doris Feldman Benezra Living Trust and Benezra
Current Estimated Value
Purchase Details
Closed on
Feb 26, 2019
Sold by
Benezra Doris
Bought by
Benezra Doris and Doris Feldman Benezra Living T
Purchase Details
Closed on
Jul 8, 2014
Sold by
Benezra Doris
Bought by
Benezra Doris and The Doris Feldman Benezra Livi
Home Financials for this Owner
Home Financials are based on the most recent Mortgage that was taken out on this home.
Original Mortgage
$297,500
Interest Rate
4.16%
Mortgage Type
New Conventional
Create a Home Valuation Report for This Property
The Home Valuation Report is an in-depth analysis detailing your home's value as well as a comparison with similar homes in the area
Home Values in the Area
Average Home Value in this Area
Purchase History
| Date | Buyer | Sale Price | Title Company |
|---|---|---|---|
| Doris Feldman Benezra Living Trust | -- | None Listed On Document | |
| Doris Feldman Benezra Living Trust | -- | None Listed On Document | |
| Benezra Doris | -- | None Available | |
| Benezra Doris | -- | North American Title Co | |
| Benezra Doris | -- | North American Title |
Source: Public Records
Mortgage History
| Date | Status | Borrower | Loan Amount |
|---|---|---|---|
| Previous Owner | Benezra Doris | $297,500 |
Source: Public Records
Tax History Compared to Growth
Tax History
| Year | Tax Paid | Tax Assessment Tax Assessment Total Assessment is a certain percentage of the fair market value that is determined by local assessors to be the total taxable value of land and additions on the property. | Land | Improvement |
|---|---|---|---|---|
| 2025 | $5,011 | $355,432 | $213,261 | $142,171 |
| 2024 | $5,011 | $348,464 | $209,080 | $139,384 |
| 2023 | $4,963 | $341,632 | $204,981 | $136,651 |
| 2022 | $5,048 | $334,934 | $200,962 | $133,972 |
| 2021 | $4,996 | $328,368 | $197,022 | $131,346 |
| 2020 | $4,787 | $325,002 | $195,002 | $130,000 |
| 2019 | $4,712 | $318,630 | $191,179 | $127,451 |
| 2018 | $4,572 | $312,383 | $187,431 | $124,952 |
| 2016 | $4,325 | $300,253 | $180,153 | $120,100 |
| 2015 | $4,286 | $295,743 | $177,447 | $118,296 |
| 2014 | $4,290 | $289,951 | $173,972 | $115,979 |
Source: Public Records
Map
Nearby Homes
- 10701 Doty Ave
- 3803 W 107th St
- 3856 W 108th St
- 3871 W 109th St Unit 1
- 3847 W 110th St
- 3751 W 106th St
- 3668 W 109th St
- 3724 W 105th St
- 3700 W 105th St
- 3623 W 105th St
- 10914 S Osage Ave
- 3743 W 112th St
- 4115 W 111th St
- 3511 W 111th St
- 3713 W Imperial Hwy
- 4136 W 111th St
- 4077 W 103rd St
- 4203 W 104th St
- 3314 -3316 W Imperial Hwy
- 4061 W 101st St
- 3813 W 108th St
- 3825 W 108th St Unit 3827
- 3825 W 108th St
- 3809 W 108th St
- 3833 W 108th St
- 3805 W 108th St
- 3806 W 107th St
- 3837 W 108th St
- 3812 W 107th St
- 10717 Doty Ave
- 3800 W 107th St
- 3801 W 108th St
- 3816 W 107th St
- 3818 W 108th St
- 10713 Doty Ave
- 3824 W 108th St Unit 1
- 3814 W 108th St
- 3820 W 107th St
- 3843 W 108th St