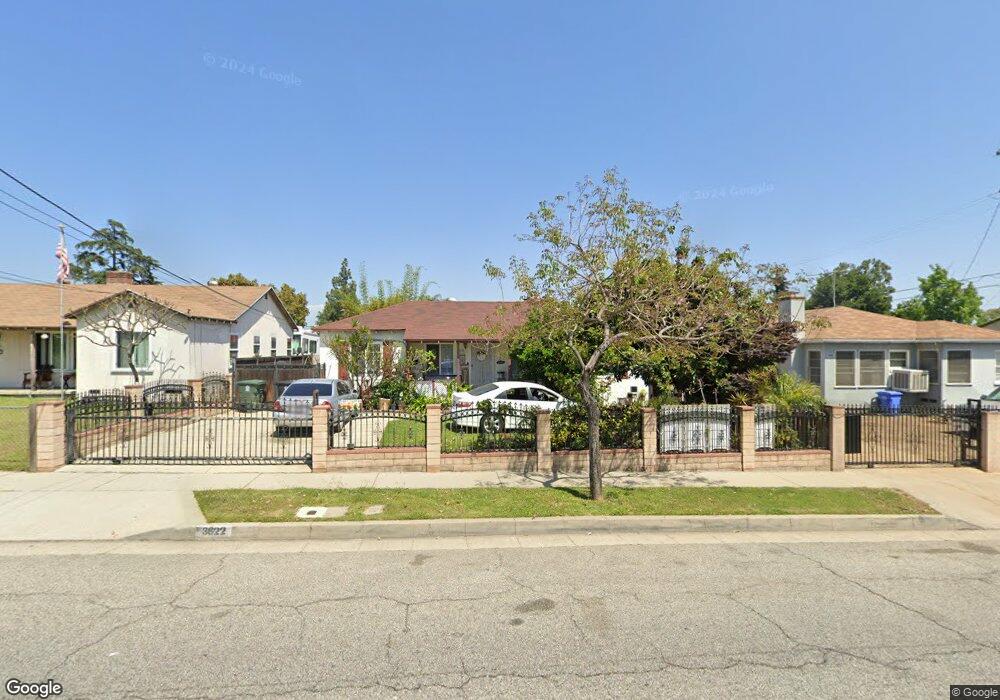
3822 Rio Hondo Ave Rosemead, CA 91770
Estimated Value: $826,663 - $1,041,000
3
Beds
1
Bath
1,107
Sq Ft
$838/Sq Ft
Est. Value
About This Home
This home is located at 3822 Rio Hondo Ave, Rosemead, CA 91770 and is currently estimated at $927,166, approximately $837 per square foot. 3822 Rio Hondo Ave is a home located in Los Angeles County with nearby schools including Savannah Elementary School, Muscatel Middle School, and Rosemead High School.
Ownership History
Date
Name
Owned For
Owner Type
Purchase Details
Closed on
Aug 11, 2023
Sold by
Ly Andy Leang and Ly Kathy Ngan
Bought by
Andy Leang Ly And Kathy Ngan Ly Living Trust and Ly
Current Estimated Value
Purchase Details
Closed on
Aug 21, 2002
Sold by
Ly Andy Leang and Hi Luc A
Bought by
Ly Andy Leang and Ly Kathy Ngan
Home Financials for this Owner
Home Financials are based on the most recent Mortgage that was taken out on this home.
Original Mortgage
$118,000
Interest Rate
6.24%
Purchase Details
Closed on
Sep 15, 1998
Sold by
Ku Tsu Hsun and Ku Hsi M
Bought by
Ly Andy Leang and Hi Luc A
Home Financials for this Owner
Home Financials are based on the most recent Mortgage that was taken out on this home.
Original Mortgage
$120,000
Interest Rate
6.89%
Create a Home Valuation Report for This Property
The Home Valuation Report is an in-depth analysis detailing your home's value as well as a comparison with similar homes in the area
Home Values in the Area
Average Home Value in this Area
Purchase History
| Date | Buyer | Sale Price | Title Company |
|---|---|---|---|
| Andy Leang Ly And Kathy Ngan Ly Living Trust | -- | None Listed On Document | |
| Ly Andy Leang | -- | Commerce Title | |
| Ly Andy Leang | $175,000 | Old Republic Title Company |
Source: Public Records
Mortgage History
| Date | Status | Borrower | Loan Amount |
|---|---|---|---|
| Previous Owner | Ly Andy Leang | $118,000 | |
| Previous Owner | Ly Andy Leang | $120,000 |
Source: Public Records
Tax History Compared to Growth
Tax History
| Year | Tax Paid | Tax Assessment Tax Assessment Total Assessment is a certain percentage of the fair market value that is determined by local assessors to be the total taxable value of land and additions on the property. | Land | Improvement |
|---|---|---|---|---|
| 2025 | $4,038 | $303,620 | $205,324 | $98,296 |
| 2024 | $4,038 | $297,668 | $201,299 | $96,369 |
| 2023 | $4,017 | $291,832 | $197,352 | $94,480 |
| 2022 | $3,882 | $286,111 | $193,483 | $92,628 |
| 2021 | $3,837 | $280,502 | $189,690 | $90,812 |
| 2019 | $3,775 | $272,183 | $184,064 | $88,119 |
| 2018 | $3,587 | $266,847 | $180,455 | $86,392 |
| 2016 | $3,413 | $256,488 | $173,449 | $83,039 |
| 2015 | $3,416 | $252,636 | $170,844 | $81,792 |
| 2014 | $3,347 | $247,688 | $167,498 | $80,190 |
Source: Public Records
Map
Nearby Homes
- 9336 Ralph St
- 3565 Lashbrook Ave
- 3742 Temple City Blvd
- 3516 Marybeth Ave
- 4110 Loma Ave
- 9620 Lorica St
- 9614 Lorica St
- 9043 Steele St
- 4320 Rio Hondo Ave
- 4332 Rio Hondo Ave
- 9925 Woodrich Ln
- 4013 Rowland Ave
- 3708 Baldwin Ave Unit 6
- 70 Linden Ln
- 4124 Ivar Ave
- 10115 Olney St
- 0 Muscatel Ave
- 9109 Lower Azusa Rd
- 4302 Ivar Ave
- 3161 Adelia Ave
- 3828 Rio Hondo Ave
- 3818 Rio Hondo Ave
- 9416 Ralph St
- 3810 Rio Hondo Ave
- 9420 Ralph St
- 3840 Rio Hondo Ave
- 3802 Rio Hondo Ave
- 3823 Rio Hondo Ave
- 9415 De Adalena St
- 9426 Ralph St
- 3829 Rio Hondo Ave
- 9423 De Adalena St
- 3815 Rio Hondo Ave
- 3811 Rio Hondo Ave
- 3846 Rio Hondo Ave
- 3841 Rio Hondo Ave
- 9432 Ralph St Unit B
- 9432 Ralph St
- 9427 De Adalena St
- 9417 Ralph St