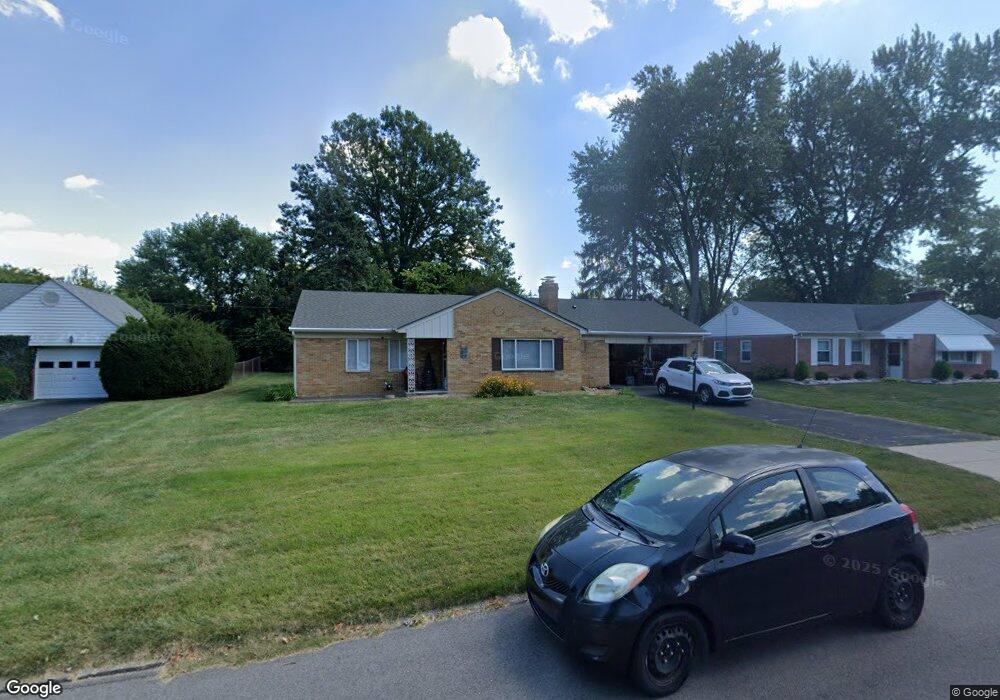
3822 Strathmoor Dr Dayton, OH 45429
Estimated Value: $217,101 - $271,000
3
Beds
1
Bath
1,318
Sq Ft
$192/Sq Ft
Est. Value
About This Home
This home is located at 3822 Strathmoor Dr, Dayton, OH 45429 and is currently estimated at $253,025, approximately $191 per square foot. 3822 Strathmoor Dr is a home located in Montgomery County with nearby schools including Southdale Elementary School, Van Buren Middle School, and Kettering Fairmont High School.
Ownership History
Date
Name
Owned For
Owner Type
Purchase Details
Closed on
Sep 11, 2019
Sold by
Dennison Lisa A
Bought by
La Dennison Properties Ii Llc
Current Estimated Value
Purchase Details
Closed on
Oct 27, 2017
Sold by
Smith Marianne
Bought by
Dennison Lisa A
Home Financials for this Owner
Home Financials are based on the most recent Mortgage that was taken out on this home.
Original Mortgage
$80,000
Outstanding Balance
$67,001
Interest Rate
3.83%
Mortgage Type
Future Advance Clause Open End Mortgage
Estimated Equity
$186,024
Purchase Details
Closed on
Jan 26, 2005
Sold by
Naef Merton A and Bissonett Teresa L
Bought by
Smith Marianne
Purchase Details
Closed on
Jun 3, 1999
Sold by
Haenzi Suzanne
Bought by
Haenzi Suzanne B and Suzanne B Haenzi Living Trust
Create a Home Valuation Report for This Property
The Home Valuation Report is an in-depth analysis detailing your home's value as well as a comparison with similar homes in the area
Home Values in the Area
Average Home Value in this Area
Purchase History
| Date | Buyer | Sale Price | Title Company |
|---|---|---|---|
| La Dennison Properties Ii Llc | -- | None Available | |
| Dennison Lisa A | $100,000 | None Available | |
| Smith Marianne | $98,000 | Chicago Title Insurance Co | |
| Haenzi Suzanne B | -- | -- |
Source: Public Records
Mortgage History
| Date | Status | Borrower | Loan Amount |
|---|---|---|---|
| Open | Dennison Lisa A | $80,000 |
Source: Public Records
Tax History Compared to Growth
Tax History
| Year | Tax Paid | Tax Assessment Tax Assessment Total Assessment is a certain percentage of the fair market value that is determined by local assessors to be the total taxable value of land and additions on the property. | Land | Improvement |
|---|---|---|---|---|
| 2024 | $3,216 | $50,700 | $20,480 | $30,220 |
| 2023 | $3,216 | $50,700 | $20,480 | $30,220 |
| 2022 | $2,864 | $35,700 | $14,420 | $21,280 |
| 2021 | $2,654 | $35,700 | $14,420 | $21,280 |
| 2020 | $2,662 | $35,700 | $14,420 | $21,280 |
| 2019 | $3,596 | $42,740 | $14,420 | $28,320 |
| 2018 | $3,615 | $42,740 | $14,420 | $28,320 |
| 2017 | $3,337 | $42,740 | $14,420 | $28,320 |
| 2016 | $3,141 | $37,780 | $14,420 | $23,360 |
| 2015 | $3,004 | $37,780 | $14,420 | $23,360 |
| 2014 | $3,004 | $37,780 | $14,420 | $23,360 |
| 2012 | -- | $42,280 | $14,420 | $27,860 |
Source: Public Records
Map
Nearby Homes
- 115 N Bromfield Rd
- 305 Glenridge Rd
- 604 Schuyler Dr
- 298 Marchester Dr
- 3212 Lenox Dr
- 101 Blue Gate Cir Unit 1
- 645 Brookfield Rd
- 3325 Ridgeway Rd
- 4259 Maxlin Rd
- 503 Cottingwood Ct
- 3993 Applewood Ln
- 117 Cushing Ave
- 3822 Milford Dr
- 424 Cushing Ave
- 587 Cottingwood Ct
- 791 Willowdale Ave
- 441 Cushing Ave
- 309 Lewiston Rd
- 855 Brookfield Rd
- 320 E Dorothy Ln
- 3818 Strathmoor Dr
- 3900 Strathmoor Dr
- 3809 Far Hills Ave
- 3813 Far Hills Ave
- 3817 Far Hills Ave
- 3906 Strathmoor Dr
- 3817 Strathmoor Dr
- 3821 Strathmoor Dr
- 3851 Far Hills Ave
- 3901 Strathmoor Dr
- 3813 Strathmoor Dr
- 3915 Strathmoor Dr
- 3857 Far Hills Ave
- 3910 Strathmoor Dr
- 3805 Strathmoor Dr
- 3861 Far Hills Ave
- 3861 Far Hills Ave
- 3826 Kenwick Dr
- 3919 Strathmoor Dr
- 3801 Strathmoor Dr