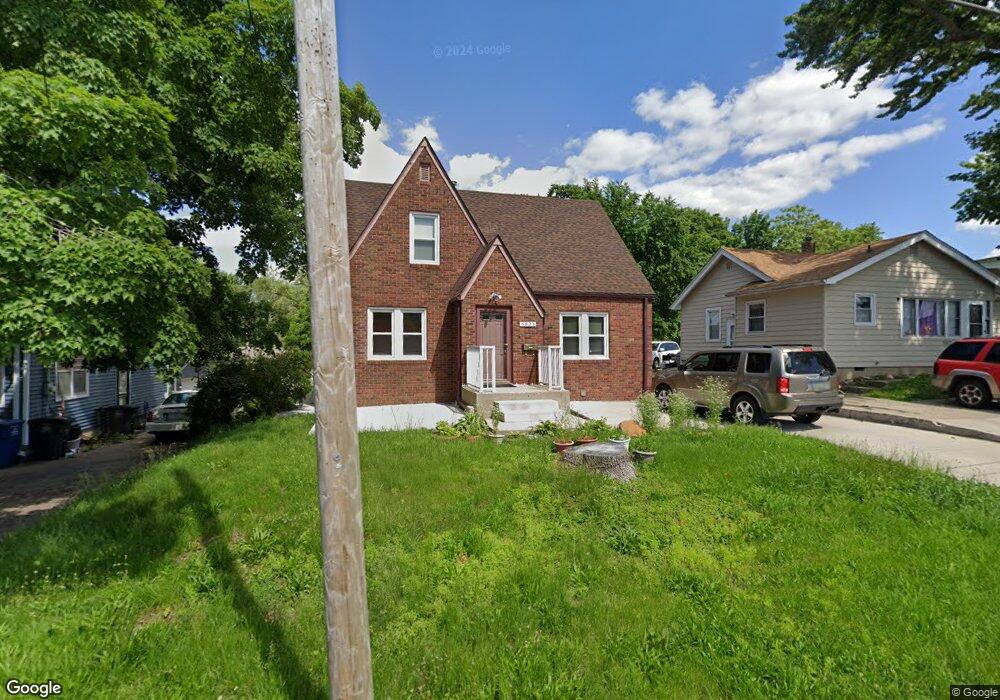
3823 1st St Des Moines, IA 50313
Highland Park NeighborhoodEstimated Value: $184,000 - $222,000
3
Beds
2
Baths
1,409
Sq Ft
$143/Sq Ft
Est. Value
About This Home
This home is located at 3823 1st St, Des Moines, IA 50313 and is currently estimated at $202,132, approximately $143 per square foot. 3823 1st St is a home located in Polk County with nearby schools including Madison Elementary School, Harding Middle School, and North High School.
Ownership History
Date
Name
Owned For
Owner Type
Purchase Details
Closed on
Aug 7, 2019
Sold by
The Estate Of Henry P Rodgers
Bought by
Escalante Rina C
Current Estimated Value
Purchase Details
Closed on
Sep 14, 1998
Sold by
Johanna V Hackett Trust
Bought by
Rodgers Henry Paul
Home Financials for this Owner
Home Financials are based on the most recent Mortgage that was taken out on this home.
Original Mortgage
$59,200
Interest Rate
7.02%
Create a Home Valuation Report for This Property
The Home Valuation Report is an in-depth analysis detailing your home's value as well as a comparison with similar homes in the area
Home Values in the Area
Average Home Value in this Area
Purchase History
| Date | Buyer | Sale Price | Title Company |
|---|---|---|---|
| Escalante Rina C | -- | None Available | |
| Rodgers Henry Paul | -- | -- | |
| Rodgers Henry Paul | $73,500 | -- |
Source: Public Records
Mortgage History
| Date | Status | Borrower | Loan Amount |
|---|---|---|---|
| Previous Owner | Rodgers Henry Paul | $59,200 |
Source: Public Records
Tax History
| Year | Tax Paid | Tax Assessment Tax Assessment Total Assessment is a certain percentage of the fair market value that is determined by local assessors to be the total taxable value of land and additions on the property. | Land | Improvement |
|---|---|---|---|---|
| 2025 | $3,450 | $199,400 | $29,200 | $170,200 |
| 2024 | $3,450 | $175,400 | $25,300 | $150,100 |
| 2023 | $3,338 | $175,400 | $25,300 | $150,100 |
| 2022 | $3,312 | $141,600 | $21,400 | $120,200 |
| 2021 | $3,166 | $141,600 | $21,400 | $120,200 |
| 2020 | $3,290 | $126,900 | $19,100 | $107,800 |
| 2019 | $3,172 | $126,900 | $19,100 | $107,800 |
| 2018 | $3,140 | $118,000 | $17,400 | $100,600 |
| 2017 | $2,918 | $118,000 | $17,400 | $100,600 |
| 2016 | $2,844 | $107,900 | $15,600 | $92,300 |
| 2015 | $2,844 | $107,900 | $15,600 | $92,300 |
| 2014 | $2,792 | $105,100 | $14,900 | $90,200 |
Source: Public Records
Map
Nearby Homes
- 3615 Cambridge St
- 3905 Cambridge St
- 3837 3rd St
- 3814 Columbia St
- 3938 1st St
- 3419 1st St
- 3413 2nd Ave
- 3832 Bowdoin St
- 3803 Bowdoin St
- 3633 Bowdoin St
- 3308 Cambridge St
- 3311 2nd Ave
- 3507 Bowdoin St
- 3218 2nd Ave
- 3701 Amherst St
- 4019 Columbia St
- 4012 Bowdoin St
- 3301 Columbia St
- 3421 Amherst St
- 3314 5th Ave
Your Personal Tour Guide
Ask me questions while you tour the home.