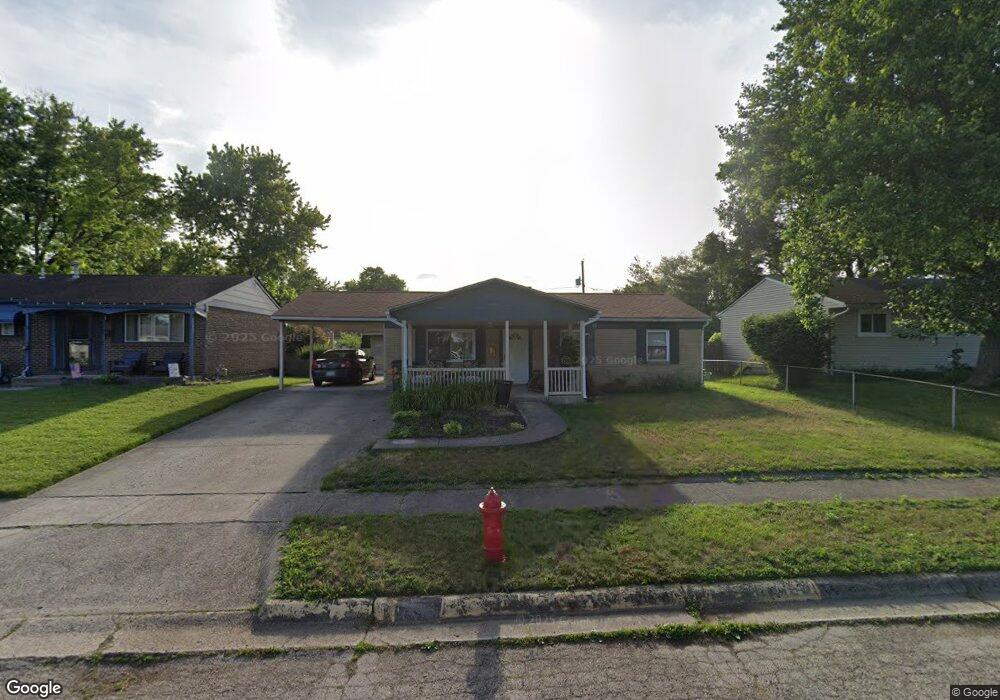
3823 Atkinson Rd Columbus, OH 43232
East Columbus-White Ash NeighborhoodEstimated Value: $165,894 - $194,000
3
Beds
1
Bath
912
Sq Ft
$204/Sq Ft
Est. Value
About This Home
This home is located at 3823 Atkinson Rd, Columbus, OH 43232 and is currently estimated at $185,724, approximately $203 per square foot. 3823 Atkinson Rd is a home located in Franklin County with nearby schools including Groveport Madison High School, Eastland Preparatory Academy, and A+ Arts Academy.
Ownership History
Date
Name
Owned For
Owner Type
Purchase Details
Closed on
Aug 29, 2006
Sold by
Ohio Homes Inc
Bought by
Richardson Mark S and Richardson Diana L
Current Estimated Value
Home Financials for this Owner
Home Financials are based on the most recent Mortgage that was taken out on this home.
Original Mortgage
$83,991
Outstanding Balance
$50,220
Interest Rate
6.59%
Mortgage Type
FHA
Estimated Equity
$135,504
Purchase Details
Closed on
Mar 14, 2006
Sold by
Us Bank Na
Bought by
Ohio Homes Inc
Home Financials for this Owner
Home Financials are based on the most recent Mortgage that was taken out on this home.
Original Mortgage
$70,000
Interest Rate
6.34%
Mortgage Type
Purchase Money Mortgage
Purchase Details
Closed on
Dec 6, 2005
Sold by
Haynes David Clyde and Haynes David C
Bought by
Us Bank Na and Registered Holders Of Home Equity Asset
Purchase Details
Closed on
Apr 29, 1991
Bought by
Haynes David C
Purchase Details
Closed on
Apr 19, 1991
Create a Home Valuation Report for This Property
The Home Valuation Report is an in-depth analysis detailing your home's value as well as a comparison with similar homes in the area
Home Values in the Area
Average Home Value in this Area
Purchase History
| Date | Buyer | Sale Price | Title Company |
|---|---|---|---|
| Richardson Mark S | $84,700 | Lawyers Tit | |
| Ohio Homes Inc | $62,000 | Titlequest | |
| Us Bank Na | $48,000 | -- | |
| Haynes David C | -- | -- | |
| -- | $42,900 | -- |
Source: Public Records
Mortgage History
| Date | Status | Borrower | Loan Amount |
|---|---|---|---|
| Open | Richardson Mark S | $83,991 | |
| Closed | Ohio Homes Inc | $70,000 |
Source: Public Records
Tax History Compared to Growth
Tax History
| Year | Tax Paid | Tax Assessment Tax Assessment Total Assessment is a certain percentage of the fair market value that is determined by local assessors to be the total taxable value of land and additions on the property. | Land | Improvement |
|---|---|---|---|---|
| 2024 | $2,728 | $55,100 | $14,180 | $40,920 |
| 2023 | $2,710 | $55,090 | $14,175 | $40,915 |
| 2022 | $1,699 | $27,370 | $6,300 | $21,070 |
| 2021 | $1,741 | $27,370 | $6,300 | $21,070 |
| 2020 | $1,745 | $27,370 | $6,300 | $21,070 |
| 2019 | $1,650 | $22,720 | $5,250 | $17,470 |
| 2018 | $1,714 | $22,720 | $5,250 | $17,470 |
| 2017 | $1,670 | $22,720 | $5,250 | $17,470 |
| 2016 | $1,769 | $21,880 | $4,100 | $17,780 |
| 2015 | $1,769 | $21,880 | $4,100 | $17,780 |
| 2014 | $1,623 | $21,880 | $4,100 | $17,780 |
| 2013 | $790 | $24,290 | $4,550 | $19,740 |
Source: Public Records
Map
Nearby Homes
- 3739 Atkinson Rd
- 3773 Clearwater Dr
- 3773 Tylor Dr
- 5174 Fullerton Dr
- 3721 Aurelia Dr
- 5106 Harbor Blvd
- 5145 Fullerton Dr
- 5044 Albany Dr
- 5096 Fullerton Dr
- 3567 Wymore Place
- 5004 Bentler Dr
- 5391 Newport Rd
- 3493 Tremaine Rd
- 5254 Sedalia Dr
- 4940 Brewster Dr
- 3496 Cadell Rd
- 3900 Noe Bixby Rd
- 5522 Newport Ct
- 5630 Shannon Rd
- 5408 Rohden Dr
- 3811 Atkinson Rd
- 3831 Atkinson Rd
- 3814 Evanston Rd
- 3839 Atkinson Rd
- 3805 Atkinson Rd
- 3806 Evanston Rd
- 3826 Evanston Rd
- 3834 Evanston Rd
- 3822 Atkinson Rd
- 3794 Evanston Rd
- 3830 Atkinson Rd
- 3845 Atkinson Rd
- 3814 Atkinson Rd
- 3795 Atkinson Rd
- 3838 Atkinson Rd
- 3806 Atkinson Rd
- 3842 Evanston Rd
- 3786 Evanston Rd
- 3853 Atkinson Rd
- 3787 Atkinson Rd