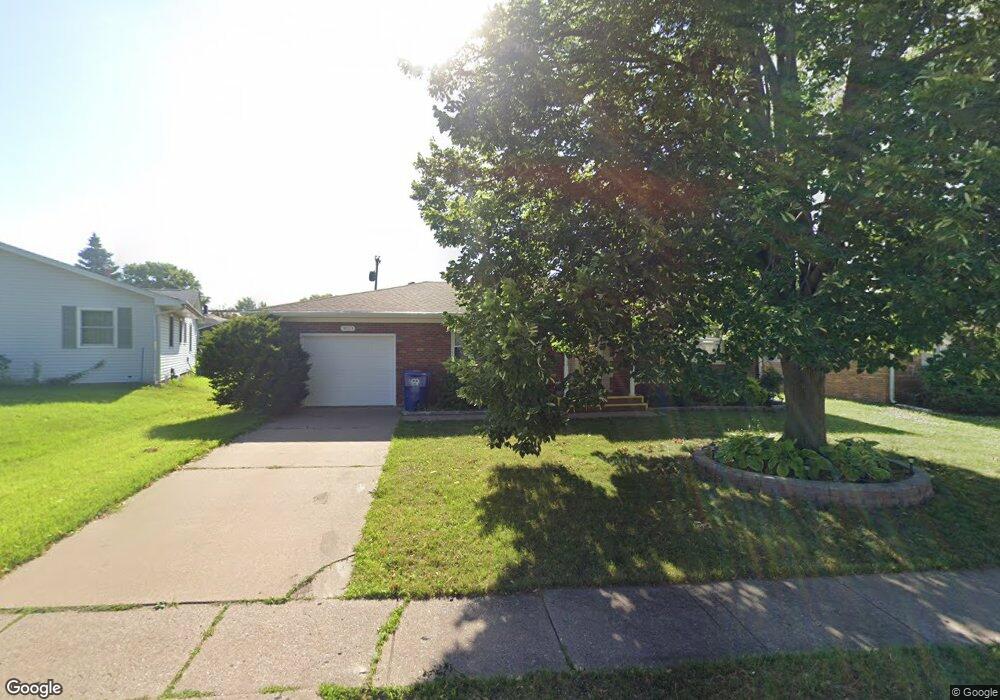
3823 Kelling St Davenport, IA 52806
Northwest Davenport NeighborhoodEstimated Value: $170,977 - $228,000
2
Beds
1
Bath
1,091
Sq Ft
$181/Sq Ft
Est. Value
About This Home
This home is located at 3823 Kelling St, Davenport, IA 52806 and is currently estimated at $197,244, approximately $180 per square foot. 3823 Kelling St is a home located in Scott County with nearby schools including Tygart Creek Elementary School, South Christian Elementary School, and Adams Elementary School.
Ownership History
Date
Name
Owned For
Owner Type
Purchase Details
Closed on
Nov 7, 2023
Sold by
Mayfield Charlotte
Bought by
Mayfield Charlotte and Broyles Emily Renae
Current Estimated Value
Purchase Details
Closed on
Sep 23, 2011
Sold by
Slade Steven L and Slade Jeannette L
Bought by
Mayfield Charlotte
Home Financials for this Owner
Home Financials are based on the most recent Mortgage that was taken out on this home.
Original Mortgage
$101,600
Interest Rate
4.14%
Mortgage Type
New Conventional
Purchase Details
Closed on
Feb 16, 2011
Sold by
Secretary Of Veterans Affairs
Bought by
Slade Steven L and Slade Jeannette L
Purchase Details
Closed on
Oct 8, 2010
Sold by
Bac Home Loans Servicing L P
Bought by
Secretary Of The Department Of Veterans
Purchase Details
Closed on
Oct 6, 2010
Sold by
Lutz Kenneth D
Bought by
Bac Home Loans Servicing Lp and Countrywide Home Loans Servicing Lp
Create a Home Valuation Report for This Property
The Home Valuation Report is an in-depth analysis detailing your home's value as well as a comparison with similar homes in the area
Home Values in the Area
Average Home Value in this Area
Purchase History
| Date | Buyer | Sale Price | Title Company |
|---|---|---|---|
| Mayfield Charlotte | -- | None Listed On Document | |
| Mayfield Charlotte | $127,000 | None Available | |
| Slade Steven L | $82,000 | None Available | |
| Secretary Of The Department Of Veterans | $100,500 | None Available | |
| Bac Home Loans Servicing Lp | $100,024 | None Available |
Source: Public Records
Mortgage History
| Date | Status | Borrower | Loan Amount |
|---|---|---|---|
| Previous Owner | Mayfield Charlotte | $101,600 |
Source: Public Records
Tax History Compared to Growth
Tax History
| Year | Tax Paid | Tax Assessment Tax Assessment Total Assessment is a certain percentage of the fair market value that is determined by local assessors to be the total taxable value of land and additions on the property. | Land | Improvement |
|---|---|---|---|---|
| 2025 | $2,592 | $186,380 | $29,330 | $157,050 |
| 2024 | $2,642 | $168,920 | $29,330 | $139,590 |
| 2023 | $2,736 | $168,920 | $29,330 | $139,590 |
| 2022 | $2,664 | $137,000 | $26,240 | $110,760 |
| 2021 | $2,664 | $133,110 | $26,240 | $106,870 |
| 2020 | $2,700 | $133,110 | $26,240 | $106,870 |
| 2019 | $2,680 | $123,400 | $26,240 | $97,160 |
| 2018 | $2,412 | $123,400 | $26,240 | $97,160 |
| 2017 | $2,502 | $118,530 | $26,240 | $92,290 |
| 2016 | $2,404 | $118,530 | $0 | $0 |
| 2015 | $2,404 | $120,900 | $0 | $0 |
| 2014 | $2,492 | $120,900 | $0 | $0 |
| 2013 | $2,444 | $0 | $0 | $0 |
| 2012 | -- | $116,280 | $25,720 | $90,560 |
Source: Public Records
Map
Nearby Homes
- 3612 Wilkes Ave
- 2159 W 35th St
- Lot 29 W 34th St
- 4132 Rodeo Rd
- 2223 W 34th St
- 1617 W 38th St
- 4104 N Linwood Ave
- 4406 Regency Place
- 3831 N Sturdevant St
- 4123 N Linwood Ave
- 3812 N Thornwood Ave
- 3205 N Pine St
- 1517 W Kimberly Rd
- 2724 W 38th Place
- 3812 Joyce Ln
- 2728 W 38th Place
- 2222 W 30th St
- 3011 N Pine St
- 2149 W 30th St
- 3433 Washington St
- 3817 Kelling St
- 3829 Kelling St
- 3811 Kelling St
- 3824 Pacific St
- 3830 Pacific St
- 3818 Pacific St
- 3838 Pacific St
- 3824 Kelling St
- 3812 Pacific St
- 3818 Kelling St
- 2024 W 38th St
- 3844 Pacific St
- 3810 Kelling St
- 2006 W 38th St
- 3839 Kelling St
- 2106 W 38th St
- 2115 W 38th Place
- 2017 W Kimberly Rd
- 3821 Pacific St
- 2011 W Kimberly Rd