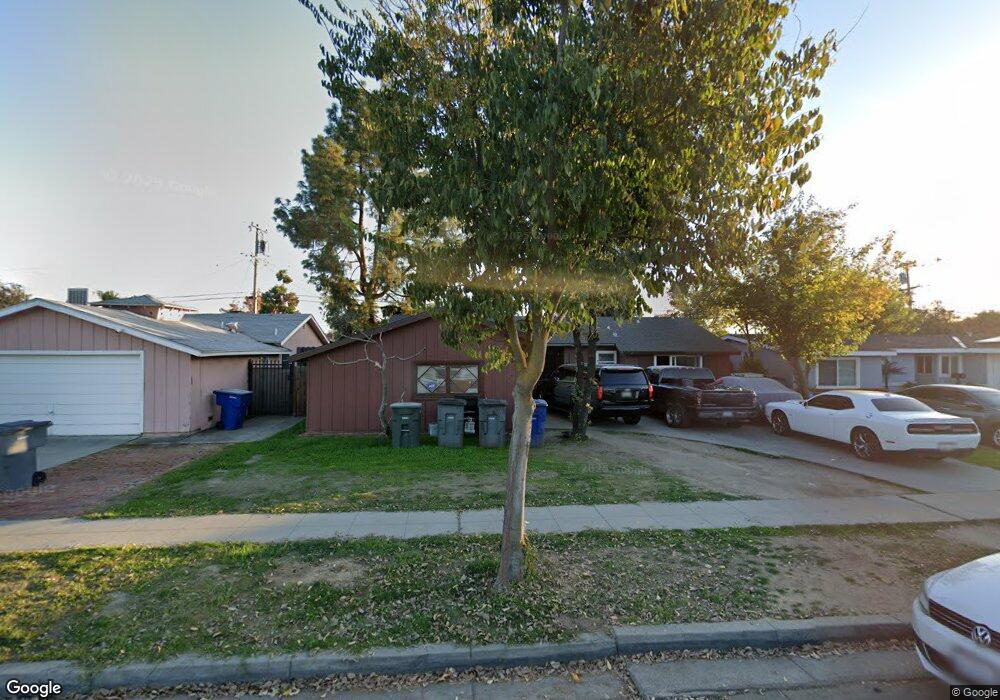
3824 E Holland Ave Fresno, CA 93726
Hoover NeighborhoodEstimated Value: $262,000 - $341,000
3
Beds
2
Baths
1,127
Sq Ft
$275/Sq Ft
Est. Value
About This Home
This home is located at 3824 E Holland Ave, Fresno, CA 93726 and is currently estimated at $310,059, approximately $275 per square foot. 3824 E Holland Ave is a home located in Fresno County with nearby schools including Thomas Elementary School, Tioga Middle School, and Herbert Hoover High School.
Ownership History
Date
Name
Owned For
Owner Type
Purchase Details
Closed on
Jul 30, 2012
Sold by
Sidhu Gurmeet
Bought by
Gurm Jasbir
Current Estimated Value
Purchase Details
Closed on
Jul 3, 2012
Sold by
Gurley Aurora P
Bought by
Sidhu Gurmeet
Purchase Details
Closed on
Aug 16, 2002
Sold by
Chavarria Rachel Rodriguez
Bought by
Gurley Aurora P
Home Financials for this Owner
Home Financials are based on the most recent Mortgage that was taken out on this home.
Original Mortgage
$103,500
Interest Rate
6.37%
Purchase Details
Closed on
Mar 27, 1998
Sold by
Torres Rachel C and Chavarria Rachel
Bought by
Chavarria Rachel Rodriguez
Create a Home Valuation Report for This Property
The Home Valuation Report is an in-depth analysis detailing your home's value as well as a comparison with similar homes in the area
Home Values in the Area
Average Home Value in this Area
Purchase History
| Date | Buyer | Sale Price | Title Company |
|---|---|---|---|
| Gurm Jasbir | -- | None Available | |
| Sidhu Gurmeet | $82,500 | None Available | |
| Gurley Aurora P | $115,000 | Stewart Title | |
| Chavarria Rachel Rodriguez | -- | -- |
Source: Public Records
Mortgage History
| Date | Status | Borrower | Loan Amount |
|---|---|---|---|
| Previous Owner | Gurley Aurora P | $103,500 |
Source: Public Records
Tax History
| Year | Tax Paid | Tax Assessment Tax Assessment Total Assessment is a certain percentage of the fair market value that is determined by local assessors to be the total taxable value of land and additions on the property. | Land | Improvement |
|---|---|---|---|---|
| 2025 | $1,332 | $101,583 | $36,938 | $64,645 |
| 2023 | $1,258 | $97,640 | $35,504 | $62,136 |
| 2022 | $1,241 | $95,726 | $34,808 | $60,918 |
| 2021 | $1,207 | $93,850 | $34,126 | $59,724 |
| 2020 | $1,202 | $92,889 | $33,777 | $59,112 |
| 2019 | $1,156 | $91,068 | $33,115 | $57,953 |
| 2018 | $1,131 | $89,283 | $32,466 | $56,817 |
| 2017 | $1,112 | $87,533 | $31,830 | $55,703 |
| 2016 | $1,076 | $85,817 | $31,206 | $54,611 |
| 2015 | $1,060 | $84,529 | $30,738 | $53,791 |
| 2014 | $1,040 | $82,874 | $30,136 | $52,738 |
Source: Public Records
Map
Nearby Homes
- 3915 E Holland Ave
- 3763 E Swift Ave
- 3654 E Donner Ave
- 4161 E Holland Ave
- 3789 E Hampton Way
- 4104 E Ashlan Ave
- 4365 N 5th St
- 4281 N 5th St
- 4295 N Archie Ave
- 3860 E Rialto Ave
- 3719 E Hampton Way Unit 2
- 4324 E Richert Ave
- 4045 E Bellaire Way
- 4656 N 5th St
- 3934 E Sussex Way
- 3557 E Pico Ave
- 4342 E Donner Ave
- 3365 E Ashlan Ave
- 4031 E Pontiac Way
- 4727 N Cedar Ave Unit 107
- 3834 E Holland Ave
- 3814 E Holland Ave
- 3825 E Richert Ave
- 3804 E Holland Ave
- 3835 E Richert Ave
- 3815 E Richert Ave
- 3845 E Richert Ave
- 3805 E Richert Ave
- 3813 E Holland Ave
- 3833 E Holland Ave
- 3794 E Holland Ave
- 3803 E Holland Ave
- 3843 E Holland Ave
- 3855 E Richert Ave
- 3791 E Richert Ave
- 3864 E Holland Ave
- 3786 E Holland Ave
- 3793 E Holland Ave
- 3853 E Holland Ave
- 3865 E Richert Ave
Your Personal Tour Guide
Ask me questions while you tour the home.