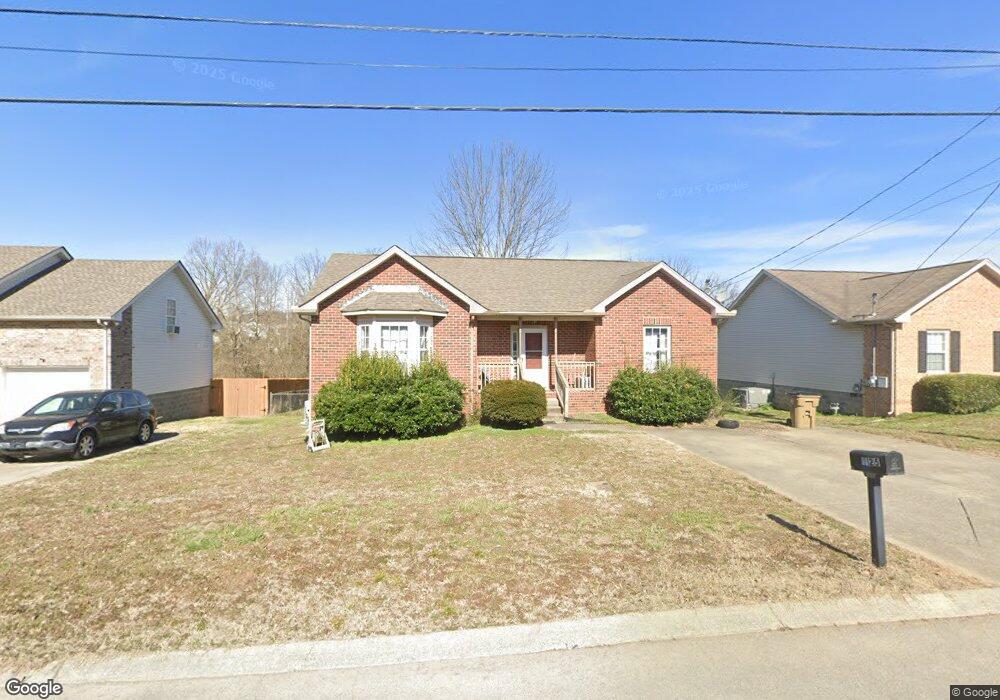
3825 Northbrook Dr Nashville, TN 37207
Bellshire Terrace NeighborhoodEstimated Value: $233,000 - $335,000
3
Beds
2
Baths
1,294
Sq Ft
$227/Sq Ft
Est. Value
About This Home
This home is located at 3825 Northbrook Dr, Nashville, TN 37207 and is currently estimated at $294,095, approximately $227 per square foot. 3825 Northbrook Dr is a home located in Davidson County with nearby schools including Bellshire Elementary Design Center, Madison Middle Prep, and Hunters Lane Comprehensive High School.
Ownership History
Date
Name
Owned For
Owner Type
Purchase Details
Closed on
Oct 31, 2014
Sold by
Smyth Barbara J
Bought by
Woodley Shermona
Current Estimated Value
Purchase Details
Closed on
May 19, 2006
Sold by
Smith Joshua H
Bought by
Smyth Samuel E and Smyth Barbara J
Home Financials for this Owner
Home Financials are based on the most recent Mortgage that was taken out on this home.
Original Mortgage
$94,500
Interest Rate
6.44%
Mortgage Type
Fannie Mae Freddie Mac
Purchase Details
Closed on
Jan 31, 2005
Sold by
Huddleston Gloria and Stewart Gloria
Bought by
Smith Joshua H
Home Financials for this Owner
Home Financials are based on the most recent Mortgage that was taken out on this home.
Original Mortgage
$52,500
Interest Rate
5.66%
Mortgage Type
Stand Alone First
Purchase Details
Closed on
Feb 6, 1998
Sold by
Asgard Group Llc
Bought by
Huddleston Gloria
Home Financials for this Owner
Home Financials are based on the most recent Mortgage that was taken out on this home.
Original Mortgage
$79,110
Interest Rate
7.07%
Create a Home Valuation Report for This Property
The Home Valuation Report is an in-depth analysis detailing your home's value as well as a comparison with similar homes in the area
Home Values in the Area
Average Home Value in this Area
Purchase History
| Date | Buyer | Sale Price | Title Company |
|---|---|---|---|
| Woodley Shermona | $87,500 | Rudy Title & Escrow Llc | |
| Smyth Samuel E | $105,000 | Commonwealth Title | |
| Smith Joshua H | $85,000 | -- | |
| Huddleston Gloria | $87,900 | -- |
Source: Public Records
Mortgage History
| Date | Status | Borrower | Loan Amount |
|---|---|---|---|
| Previous Owner | Smyth Samuel E | $94,500 | |
| Previous Owner | Smith Joshua H | $52,500 | |
| Previous Owner | Huddleston Gloria | $79,110 |
Source: Public Records
Tax History Compared to Growth
Tax History
| Year | Tax Paid | Tax Assessment Tax Assessment Total Assessment is a certain percentage of the fair market value that is determined by local assessors to be the total taxable value of land and additions on the property. | Land | Improvement |
|---|---|---|---|---|
| 2024 | $1,830 | $56,250 | $15,000 | $41,250 |
| 2023 | $1,830 | $56,250 | $15,000 | $41,250 |
| 2022 | $1,830 | $56,250 | $15,000 | $41,250 |
| 2021 | $1,850 | $56,250 | $15,000 | $41,250 |
| 2020 | $1,352 | $35,700 | $5,750 | $29,950 |
| 2019 | $984 | $35,700 | $5,750 | $29,950 |
| 2018 | $984 | $35,700 | $5,750 | $29,950 |
| 2017 | $984 | $35,700 | $5,750 | $29,950 |
| 2016 | $1,056 | $26,900 | $4,500 | $22,400 |
| 2015 | $1,056 | $26,900 | $4,500 | $22,400 |
| 2014 | $1,056 | $26,900 | $4,500 | $22,400 |
Source: Public Records
Map
Nearby Homes
- 1533 Thornton Grove Blvd
- 3946 Northbrook Dr
- 1001 Cone Blvd
- 2625 Thornton Grove Blvd
- 3525 Brookway Dr
- 4113 Walnut Ridge Dr
- 4125 Walnut Ridge Dr
- 4105 Walnut Ridge Dr
- 3529 Brookway Dr
- 4108 Walnut Ridge Dr
- Birch Plan at Thornton Grove - Single-Family Homes
- Elder Plan at Thornton Grove - Single-Family Homes
- Cedar Plan at Thornton Grove - Single-Family Homes
- Aspen Plan at Thornton Grove - Single-Family Homes
- 2665 Thornton Grove Blvd
- 2935 Winterberry Dr Unit 31
- 2935 Winterberry Dr Unit 12
- 1832 Apple Valley Cir
- 3320 Chesapeake Cir
- 4264 Skyridge Dr
- 3829 Northbrook Dr
- 3821 Northbrook Dr
- 3833 Northbrook Dr
- 3817 Northbrook Dr
- 3813 Northbrook Dr
- 3837 Northbrook Dr
- 3820 Northbrook Dr
- 3828 Northbrook Dr
- 3824 Northbrook Dr
- 3816 Northbrook Dr
- 3809 Northbrook Dr
- 3841 Northbrook Dr
- 3744 Ridge Top Dr
- 3729 Ridge Top Dr
- 3812 Northbrook Dr
- 3805 Northbrook Dr
- 3845 Northbrook Dr
- 3725 Ridge Top Dr
- 3836 Northbrook Dr
- 3740 Ridge Top Dr