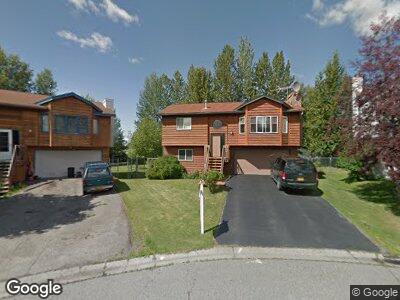
3825 Remington Cir Anchorage, AK 99507
Abbott Loop NeighborhoodEstimated Value: $247,000 - $436,000
3
Beds
2
Baths
1,469
Sq Ft
$235/Sq Ft
Est. Value
About This Home
This home is located at 3825 Remington Cir, Anchorage, AK 99507 and is currently estimated at $344,717, approximately $234 per square foot. 3825 Remington Cir is a home located in Anchorage Municipality with nearby schools including Kasuun Elementary, Hanshew Middle School, and Service High School.
Ownership History
Date
Name
Owned For
Owner Type
Purchase Details
Closed on
Nov 27, 2023
Sold by
Fillman Christopher J and Fillman Sarah M
Bought by
Christopher And Sarah Fillman Living Trust and Fillman
Current Estimated Value
Purchase Details
Closed on
Oct 3, 2011
Sold by
Griffin Paul M and Griffin Maria C
Bought by
Fillman Christopher J and Fillman Sarah M
Home Financials for this Owner
Home Financials are based on the most recent Mortgage that was taken out on this home.
Original Mortgage
$308,400
Interest Rate
4.15%
Mortgage Type
VA
Purchase Details
Closed on
Sep 28, 2005
Sold by
Thelen Mark and Thelen Tammy
Bought by
Griffin Paul M and Griffin Maria C
Home Financials for this Owner
Home Financials are based on the most recent Mortgage that was taken out on this home.
Original Mortgage
$251,910
Interest Rate
5.72%
Mortgage Type
Purchase Money Mortgage
Create a Home Valuation Report for This Property
The Home Valuation Report is an in-depth analysis detailing your home's value as well as a comparison with similar homes in the area
Home Values in the Area
Average Home Value in this Area
Purchase History
| Date | Buyer | Sale Price | Title Company |
|---|---|---|---|
| Christopher And Sarah Fillman Living Trust | -- | None Listed On Document | |
| Fillman Christopher J | -- | Stewart Title Company | |
| Griffin Paul M | -- | -- |
Source: Public Records
Mortgage History
| Date | Status | Borrower | Loan Amount |
|---|---|---|---|
| Previous Owner | Fillman Christopher J | $25,000 | |
| Previous Owner | Fillman Christopher J | $308,400 | |
| Previous Owner | Griffin Paul M | $251,910 | |
| Previous Owner | Thelen Mark | $0 | |
| Previous Owner | Thelen Mark | $50,600 |
Source: Public Records
Tax History Compared to Growth
Tax History
| Year | Tax Paid | Tax Assessment Tax Assessment Total Assessment is a certain percentage of the fair market value that is determined by local assessors to be the total taxable value of land and additions on the property. | Land | Improvement |
|---|---|---|---|---|
| 2024 | $2,814 | $399,300 | $105,900 | $293,400 |
| 2023 | $6,316 | $370,900 | $105,900 | $265,000 |
| 2022 | $2,573 | $352,800 | $105,900 | $246,900 |
| 2021 | $5,712 | $317,000 | $105,900 | $211,100 |
| 2020 | $4,391 | $308,600 | $105,900 | $202,700 |
| 2019 | $4,286 | $312,000 | $105,900 | $206,100 |
| 2018 | $4,233 | $308,100 | $105,900 | $202,200 |
| 2017 | $4,642 | $316,400 | $100,500 | $215,900 |
| 2016 | $3,928 | $310,200 | $100,500 | $209,700 |
| 2015 | $3,928 | $299,000 | $100,500 | $198,500 |
| 2014 | $3,928 | $292,400 | $85,700 | $206,700 |
Source: Public Records
Map
Nearby Homes
- 7811 Kiana Cir
- 7721 Virda Lee Cir
- 7541 Florence Cir
- L5 Corps Cir
- 7001 Miranda Dr
- 7701 Pleasure View Cir
- 7950 Casey Cir
- 8133 Parkridge Cir
- 8203 Parkridge Cir
- 4120 Coventry Dr
- L7 B3 John Wells 1952 Addition
- 3221 Racquet Cir
- 4141 Coventry Dr
- 8131 Medellin Cir
- 3540 E 65th Ave
- 3026 E 68th Ave
- 7809 Moose Run Cir
- 3810 Midvale Cir
- 7941 Alpine View Cir
- 3366 Leonard Cir
- 3825 Remington Cir
- 3819 Remington Cir
- 7350 Christopher Cir
- 3831 Remington Cir
- 7340 Christopher Cir
- 3815 Remington Cir
- 7351 Christopher Cir
- 3835 Remington Cir
- 3754 E 74th Ave
- 7341 Christopher Cir
- 7330 Christopher Cir
- 3750 Remington Cir
- 7392 Winchester St
- 3744 E 74th Ave
- 3846 Remington Cir
- 7390 Winchester St
- 3763 Encore Cir
- 7331 Christopher Cir
- 7320 Christopher Cir
- 3820 Remington Cir