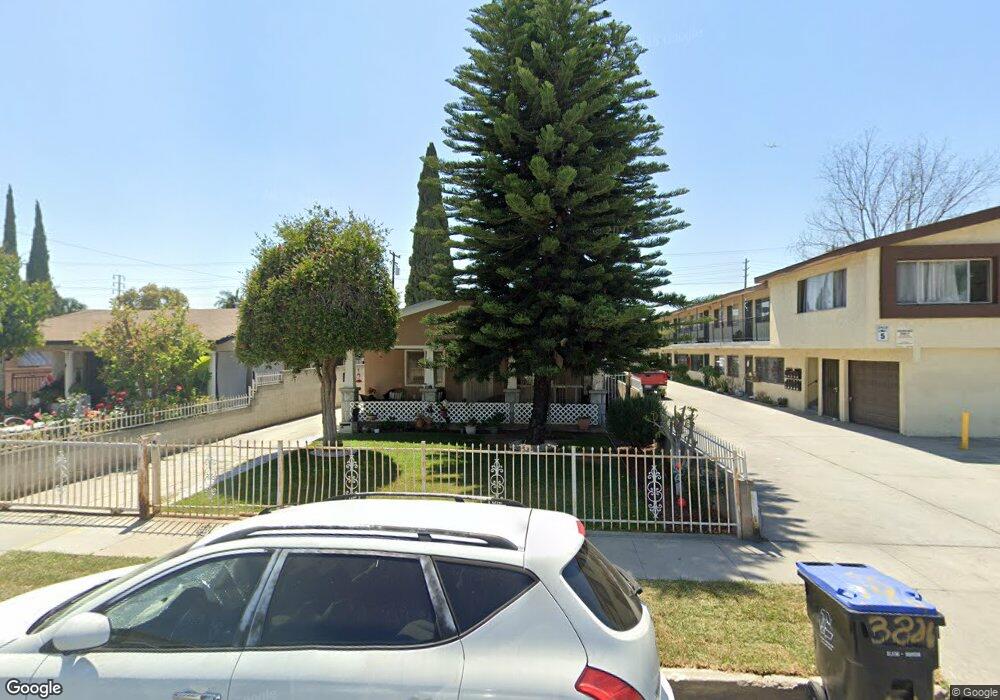
3826 E 56th St Maywood, CA 90270
Estimated Value: $721,261 - $825,000
4
Beds
3
Baths
1,684
Sq Ft
$464/Sq Ft
Est. Value
About This Home
This home is located at 3826 E 56th St, Maywood, CA 90270 and is currently estimated at $781,315, approximately $463 per square foot. 3826 E 56th St is a home located in Los Angeles County with nearby schools including Loma Vista Elementary School, Chester W. Nimitz Middle School, and Maywood Academy High School.
Ownership History
Date
Name
Owned For
Owner Type
Purchase Details
Closed on
Aug 9, 2018
Sold by
Meza Javier and Meza George
Bought by
Meza Javier
Current Estimated Value
Purchase Details
Closed on
Mar 6, 2017
Sold by
Meza Javier
Bought by
Meza Javier and Meza George
Home Financials for this Owner
Home Financials are based on the most recent Mortgage that was taken out on this home.
Original Mortgage
$286,800
Interest Rate
4.1%
Mortgage Type
New Conventional
Purchase Details
Closed on
Jan 8, 2002
Sold by
Giraldo Carmen Zoraida
Bought by
Meza Javier
Home Financials for this Owner
Home Financials are based on the most recent Mortgage that was taken out on this home.
Original Mortgage
$162,000
Interest Rate
6.84%
Purchase Details
Closed on
Jul 29, 2000
Sold by
Senalle Maria Carmen
Bought by
Giraldo Carmen Zoraida
Create a Home Valuation Report for This Property
The Home Valuation Report is an in-depth analysis detailing your home's value as well as a comparison with similar homes in the area
Home Values in the Area
Average Home Value in this Area
Purchase History
| Date | Buyer | Sale Price | Title Company |
|---|---|---|---|
| Meza Javier | -- | None Available | |
| Meza Javier | -- | Old Republic Title Company | |
| Meza Javier | $180,000 | First Southwestern Title Co | |
| Meza Javier | $180,000 | First Southwestern Title Co | |
| Giraldo Carmen Zoraida | -- | -- |
Source: Public Records
Mortgage History
| Date | Status | Borrower | Loan Amount |
|---|---|---|---|
| Previous Owner | Meza Javier | $286,800 | |
| Previous Owner | Meza Javier | $162,000 |
Source: Public Records
Tax History Compared to Growth
Tax History
| Year | Tax Paid | Tax Assessment Tax Assessment Total Assessment is a certain percentage of the fair market value that is determined by local assessors to be the total taxable value of land and additions on the property. | Land | Improvement |
|---|---|---|---|---|
| 2025 | $4,157 | $265,890 | $162,491 | $103,399 |
| 2024 | $4,157 | $260,677 | $159,305 | $101,372 |
| 2023 | $4,090 | $255,567 | $156,182 | $99,385 |
| 2022 | $3,875 | $250,557 | $153,120 | $97,437 |
| 2021 | $3,822 | $245,645 | $150,118 | $95,527 |
| 2020 | $3,842 | $243,127 | $148,579 | $94,548 |
| 2019 | $3,707 | $238,361 | $145,666 | $92,695 |
| 2018 | $3,570 | $233,688 | $142,810 | $90,878 |
| 2016 | $3,342 | $224,615 | $137,265 | $87,350 |
| 2015 | $3,156 | $221,242 | $135,204 | $86,038 |
| 2014 | $3,160 | $216,909 | $132,556 | $84,353 |
Source: Public Records
Map
Nearby Homes
- 3800 E 57th St
- 3738 E 53rd St
- 4001 E 52nd St
- 3755 E 52nd St
- 4212 E 58th St
- 5712 Fishburn Ave
- 5421 Everett Ave
- 4339 E 58th St
- 5606 Pine Ave
- 6059 Riverside Ave
- 4301 E 60th St
- 3519 E 60th St
- 4425 E 57th St
- 5503 Maywood Ave
- 6133 Orchard Ave
- 4539 E 53rd St
- 3633 Gage Ave
- 4026 Gage Ave
- 6000 Vinevale Ave
- 3201 3201 Long Beach