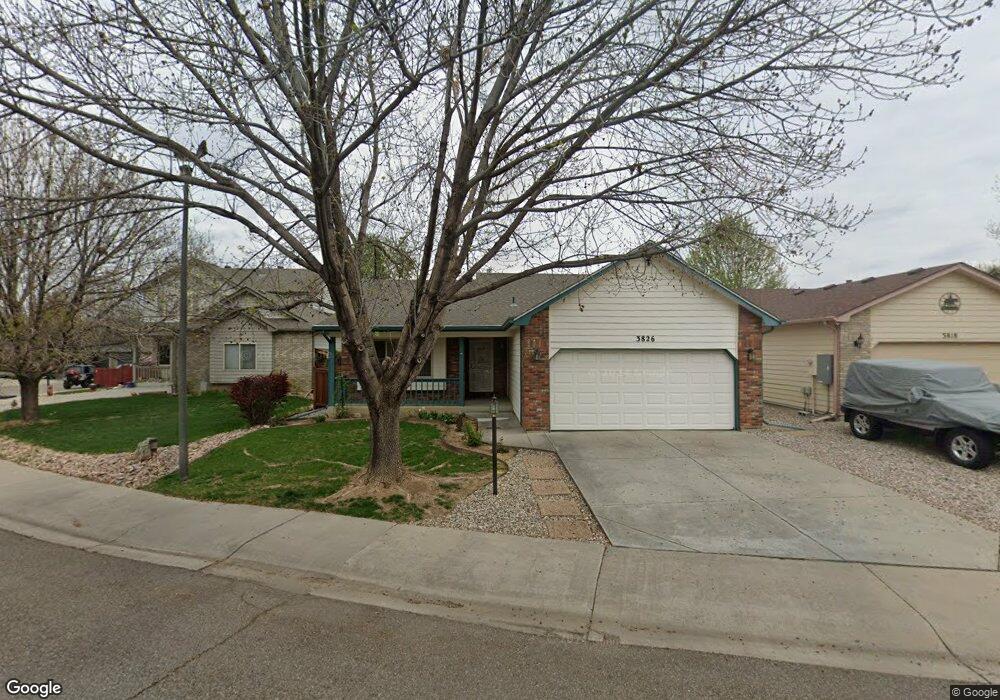
3826 Jefferson Dr Loveland, CO 80538
Estimated Value: $476,218 - $513,000
5
Beds
3
Baths
2,548
Sq Ft
$193/Sq Ft
Est. Value
About This Home
This home is located at 3826 Jefferson Dr, Loveland, CO 80538 and is currently estimated at $491,555, approximately $192 per square foot. 3826 Jefferson Dr is a home located in Larimer County with nearby schools including Peakview Academy at Conrad Ball, Stansberry Elementary School, and Mountain View High School.
Ownership History
Date
Name
Owned For
Owner Type
Purchase Details
Closed on
Apr 21, 2006
Sold by
The Gerald L Gimlin Living Trust
Bought by
Pratt Derl R and Pratt Brenda S
Current Estimated Value
Purchase Details
Closed on
Apr 27, 1999
Sold by
Gimlin Gerald L Dorothy M
Bought by
Gimlin Gerald L and Gimlin Dorothy M
Purchase Details
Closed on
Oct 16, 1997
Sold by
Progressive Living Structures Inc
Bought by
Heyne Schuster Company
Home Financials for this Owner
Home Financials are based on the most recent Mortgage that was taken out on this home.
Original Mortgage
$103,675
Interest Rate
7.54%
Purchase Details
Closed on
Oct 15, 1997
Sold by
Heyne Schuster Company
Bought by
Gimlin Gerald L and Gimlin Dorothy M
Home Financials for this Owner
Home Financials are based on the most recent Mortgage that was taken out on this home.
Original Mortgage
$103,675
Interest Rate
7.54%
Create a Home Valuation Report for This Property
The Home Valuation Report is an in-depth analysis detailing your home's value as well as a comparison with similar homes in the area
Home Values in the Area
Average Home Value in this Area
Purchase History
| Date | Buyer | Sale Price | Title Company |
|---|---|---|---|
| Pratt Derl R | $242,500 | Security Title | |
| Gimlin Gerald L | -- | -- | |
| Heyne Schuster Company | $28,000 | Stewart Title | |
| Gimlin Gerald L | $143,673 | Stewart Title |
Source: Public Records
Mortgage History
| Date | Status | Borrower | Loan Amount |
|---|---|---|---|
| Previous Owner | Gimlin Gerald L | $103,675 |
Source: Public Records
Tax History Compared to Growth
Tax History
| Year | Tax Paid | Tax Assessment Tax Assessment Total Assessment is a certain percentage of the fair market value that is determined by local assessors to be the total taxable value of land and additions on the property. | Land | Improvement |
|---|---|---|---|---|
| 2025 | $1,702 | $31,718 | $7,906 | $23,812 |
| 2024 | $1,642 | $31,718 | $7,906 | $23,812 |
| 2022 | $1,508 | $25,896 | $2,294 | $23,602 |
| 2021 | $1,549 | $26,641 | $2,360 | $24,281 |
| 2020 | $1,426 | $25,090 | $2,360 | $22,730 |
| 2019 | $1,402 | $25,090 | $2,360 | $22,730 |
| 2018 | $1,359 | $23,710 | $2,376 | $21,334 |
| 2017 | $1,170 | $23,710 | $2,376 | $21,334 |
| 2016 | $1,512 | $20,617 | $2,627 | $17,990 |
| 2015 | $1,500 | $21,070 | $2,630 | $18,440 |
| 2014 | $1,292 | $17,180 | $2,630 | $14,550 |
Source: Public Records
Map
Nearby Homes
- 4108 N Garfield Ave Unit 20
- 171 E 42nd St Unit C
- 119 E 42nd St Unit 3B
- 324 Sagewood Dr
- 4105 N Garfield Ave Unit 100
- 4105 N Garfield Ave Unit 61
- 4453 N Lincoln Ave
- 4342 Sunridge Dr
- 4386 Suncreek Dr
- 3638 Butternut Dr Unit 7A
- 126 Juniper Place
- 138 Juniper Place
- 127 Juniper Place
- 307 Juniper Place
- 3750 Sheridan Ave
- 132 W 47th Place Unit 1
- 584 Sunwood Dr
- 3244 Hawthorn Dr
- 3321 Butternut Dr
- 502 Honey Locust Dr
- 3818 Jefferson Dr
- 3844 Jefferson Dr
- 3810 Jefferson Dr
- 3853 Lindenwood Ct
- 3875 Lindenwood Ct
- 3831 Lindenwood Ct
- 3897 Lindenwood Ct
- 3781 Jefferson Dr
- 3843 Jefferson Dr
- 3802 Jefferson Dr
- 3835 Jefferson Dr
- 3851 Jefferson Dr
- 3859 Jefferson Dr
- 3809 Lindenwood Ct
- 3790 Jefferson Dr
- 3773 Jefferson Dr
- 3867 Jefferson Dr
- 3778 Jefferson Dr
- 3947 Rollingwood Dr
- 3875 Jefferson Dr