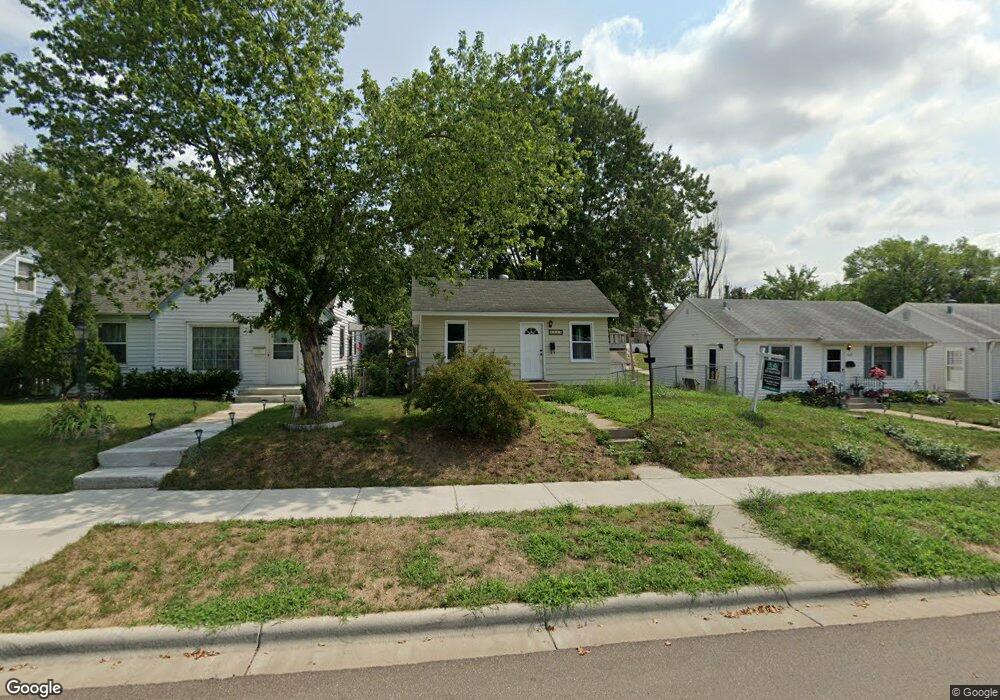
3826 Scott Ave N Robbinsdale, MN 55422
Estimated Value: $230,955 - $256,000
3
Beds
1
Bath
840
Sq Ft
$292/Sq Ft
Est. Value
About This Home
This home is located at 3826 Scott Ave N, Robbinsdale, MN 55422 and is currently estimated at $244,989, approximately $291 per square foot. 3826 Scott Ave N is a home located in Hennepin County with nearby schools including Lakeview Elementary School, Robbinsdale Middle School, and Robbinsdale Cooper Senior High School.
Ownership History
Date
Name
Owned For
Owner Type
Purchase Details
Closed on
Aug 25, 2021
Sold by
Amos Tylor
Bought by
Larson Joel T
Current Estimated Value
Home Financials for this Owner
Home Financials are based on the most recent Mortgage that was taken out on this home.
Original Mortgage
$187,200
Outstanding Balance
$170,338
Interest Rate
2.8%
Mortgage Type
New Conventional
Estimated Equity
$74,651
Purchase Details
Closed on
Oct 31, 2017
Sold by
Paladin Invetsments Llc
Bought by
Amos Tylor
Home Financials for this Owner
Home Financials are based on the most recent Mortgage that was taken out on this home.
Original Mortgage
$144,897
Interest Rate
3.87%
Mortgage Type
FHA
Purchase Details
Closed on
Feb 18, 2011
Sold by
The Bank Of New York Mellon
Bought by
H&H Real Estate Llc
Purchase Details
Closed on
Jan 28, 1998
Sold by
Certified Mtg Investment Co
Bought by
Engles Deborah
Purchase Details
Closed on
Jan 8, 1998
Sold by
Herman Clemence A and Herman Evonne A
Bought by
Certified Mtg Investments Co
Create a Home Valuation Report for This Property
The Home Valuation Report is an in-depth analysis detailing your home's value as well as a comparison with similar homes in the area
Home Values in the Area
Average Home Value in this Area
Purchase History
| Date | Buyer | Sale Price | Title Company |
|---|---|---|---|
| Larson Joel T | $208,000 | First American Title Ins Co | |
| Amos Tylor | $149,900 | Land Title Inc | |
| H&H Real Estate Llc | $48,000 | -- | |
| Engles Deborah | $85,100 | -- | |
| Certified Mtg Investments Co | $79,500 | -- | |
| Larson Joel Joel | $208,000 | -- |
Source: Public Records
Mortgage History
| Date | Status | Borrower | Loan Amount |
|---|---|---|---|
| Open | Larson Joel T | $187,200 | |
| Previous Owner | Amos Tylor | $144,897 | |
| Closed | Larson Joel Joel | $187,200 |
Source: Public Records
Tax History Compared to Growth
Tax History
| Year | Tax Paid | Tax Assessment Tax Assessment Total Assessment is a certain percentage of the fair market value that is determined by local assessors to be the total taxable value of land and additions on the property. | Land | Improvement |
|---|---|---|---|---|
| 2024 | $2,484 | $191,300 | $87,000 | $104,300 |
| 2023 | $2,460 | $194,600 | $92,000 | $102,600 |
| 2022 | $2,518 | $203,000 | $106,000 | $97,000 |
| 2021 | $2,792 | $189,000 | $99,000 | $90,000 |
| 2020 | $2,818 | $170,000 | $79,000 | $91,000 |
| 2019 | $1,991 | $171,000 | $78,000 | $93,000 |
| 2018 | $1,152 | $114,000 | $64,000 | $50,000 |
| 2017 | $1,485 | $92,000 | $49,000 | $43,000 |
| 2016 | $1,390 | $81,000 | $50,000 | $31,000 |
| 2015 | $1,358 | $80,000 | $50,000 | $30,000 |
| 2014 | -- | $80,000 | $49,000 | $31,000 |
Source: Public Records
Map
Nearby Homes
- 3755 Regent Ave N
- 3728 Regent Ave N
- 3721 Quail Ave N
- 3816 Orchard Ave N
- 3647 Orchard Ave N
- 5209 Scott Ln
- 3634 Orchard Ave N
- 3708 Xenia Ave N
- 3918 Xenia Ave N
- 4107 Regent Ave N
- 4108 Regent Ave N
- 4058 Vera Cruz Ave N
- 3715 Yates Ave N
- 5225 35th Ave N
- 5808 36th Ave N
- 3964 Hubbard Ave N
- 3833 Zane Ave N
- 4053 Yates Ave N
- 3441 Major Ave N
- 3341 Xenia Ave N
- 3820 Scott Ave N
- 3816 Scott Ave N
- 3832 Scott Ave N
- 3838 Scott Ave N
- 3808 Scott Ave N
- 3825 Regent Ave N
- 3829 Regent Ave N
- 3823 Regent Ave N
- 3833 Regent Ave N
- 3817 Regent Ave N
- 3837 Regent Ave N
- 3813 Regent Ave N
- 3844 Scott Ave N
- 3804 Scott Ave N
- 3829 Scott Ave N
- 3817 Scott Ave N
- 3841 Regent Ave N
- 3811 Regent Ave N
- 3837 Scott Ave N
- 3813 Scott Ave N