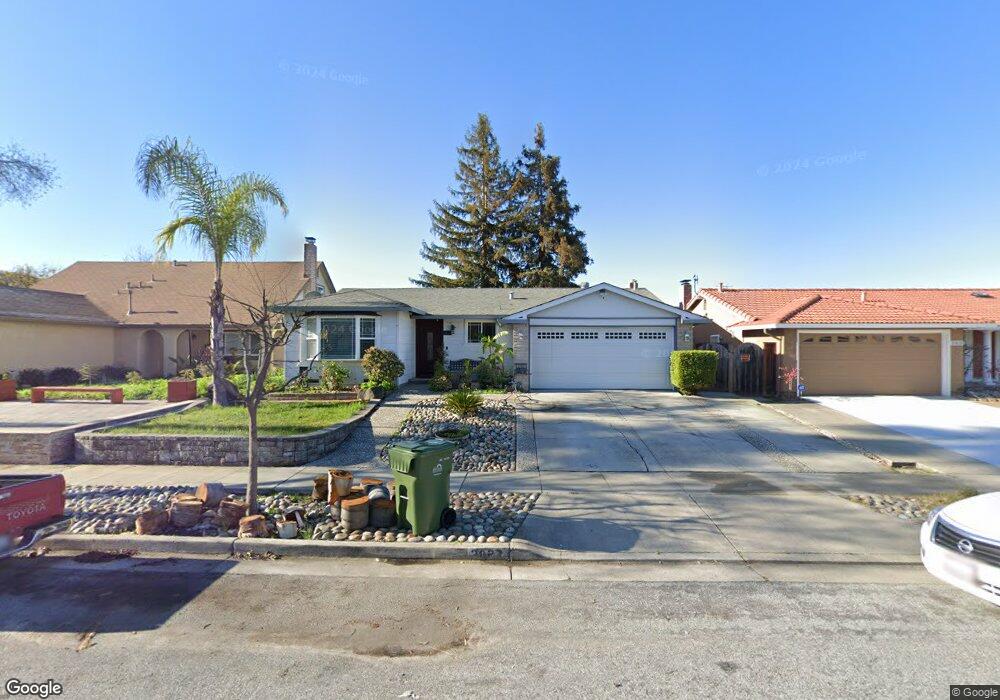
3827 Muir Place Ct San Jose, CA 95121
Dove Hill NeighborhoodEstimated Value: $1,252,324 - $1,574,000
4
Beds
2
Baths
1,478
Sq Ft
$989/Sq Ft
Est. Value
About This Home
This home is located at 3827 Muir Place Ct, San Jose, CA 95121 and is currently estimated at $1,462,331, approximately $989 per square foot. 3827 Muir Place Ct is a home located in Santa Clara County with nearby schools including John J. Montgomery Elementary School, George V. Leyva Intermediate School, and Silver Creek High School.
Ownership History
Date
Name
Owned For
Owner Type
Purchase Details
Closed on
Jan 10, 2018
Sold by
Alvarez Roberto and Alvarez Josie C
Bought by
Alvarez Roberto and Alvarez Josie C
Current Estimated Value
Purchase Details
Closed on
Sep 22, 2000
Sold by
Call Robert and Call Michele
Bought by
Alvarez Roberto and Alvarez Josie
Home Financials for this Owner
Home Financials are based on the most recent Mortgage that was taken out on this home.
Original Mortgage
$378,250
Outstanding Balance
$107,117
Interest Rate
4.95%
Estimated Equity
$1,355,214
Purchase Details
Closed on
Aug 26, 1999
Sold by
Hall Sidney C Jr Trustee
Bought by
Call Robert and Call Michele
Home Financials for this Owner
Home Financials are based on the most recent Mortgage that was taken out on this home.
Original Mortgage
$234,000
Interest Rate
7%
Purchase Details
Closed on
Jun 10, 1998
Sold by
Hall Sidney C
Bought by
Hall Sidney C
Home Financials for this Owner
Home Financials are based on the most recent Mortgage that was taken out on this home.
Original Mortgage
$42,600
Interest Rate
7.11%
Mortgage Type
Stand Alone Second
Create a Home Valuation Report for This Property
The Home Valuation Report is an in-depth analysis detailing your home's value as well as a comparison with similar homes in the area
Home Values in the Area
Average Home Value in this Area
Purchase History
| Date | Buyer | Sale Price | Title Company |
|---|---|---|---|
| Alvarez Roberto | -- | None Available | |
| Alvarez Roberto | $445,000 | Chicago Title | |
| Call Robert | $312,000 | Commonwealth Land Title Co | |
| Hall Sidney C | -- | American Title Co | |
| Hall Sidney C | -- | American Title Co |
Source: Public Records
Mortgage History
| Date | Status | Borrower | Loan Amount |
|---|---|---|---|
| Open | Alvarez Roberto | $378,250 | |
| Previous Owner | Call Robert | $234,000 | |
| Previous Owner | Hall Sidney C | $42,600 | |
| Closed | Call Robert | $62,400 |
Source: Public Records
Tax History Compared to Growth
Tax History
| Year | Tax Paid | Tax Assessment Tax Assessment Total Assessment is a certain percentage of the fair market value that is determined by local assessors to be the total taxable value of land and additions on the property. | Land | Improvement |
|---|---|---|---|---|
| 2025 | $10,087 | $670,144 | $268,053 | $402,091 |
| 2024 | $10,087 | $657,005 | $262,798 | $394,207 |
| 2023 | $9,884 | $644,124 | $257,646 | $386,478 |
| 2022 | $9,826 | $631,495 | $252,595 | $378,900 |
| 2021 | $9,641 | $619,114 | $247,643 | $371,471 |
| 2020 | $9,224 | $612,767 | $245,104 | $367,663 |
| 2019 | $8,988 | $600,753 | $240,299 | $360,454 |
| 2018 | $8,802 | $588,975 | $235,588 | $353,387 |
| 2017 | $8,660 | $577,427 | $230,969 | $346,458 |
| 2016 | $8,260 | $566,106 | $226,441 | $339,665 |
| 2015 | $8,150 | $557,603 | $223,040 | $334,563 |
| 2014 | $7,433 | $546,681 | $218,671 | $328,010 |
Source: Public Records
Map
Nearby Homes
- 3699 Cedar Knoll Ct
- 1452 Cottlestone Ct
- 1238 Stayner Rd
- 1189 Oakview Rd
- 3463 Sugarcreek Ct
- 1520 E Capitol Expy Unit 29
- 1520 E Capitol Expy
- 3891 Marfrance Dr
- 3815 Marfrance Dr
- 3789 Ashridge Ln
- 3354 Shadow Park Place Unit 319
- 3326 Shadow Park Place
- 3262 Firth Way
- 3241 Shadow Park Place
- 1868 Bagpipe Way
- 3016 Shadow Springs Place Unit 113
- 2118 Chisin St
- 2114 Bennighof Ct
- 2176 Laddie Ct
- 4171 Ambler Way
- 3835 Muir Place Ct
- 3819 Muir Place Ct
- 3824 Deans Place Way
- 3843 Muir Place Ct
- 3811 Muir Place Ct
- 3818 Deans Place Way
- 3830 Deans Place Way
- 3812 Deans Place Way
- 3836 Deans Place Way
- 3828 Muir Place Ct
- 3851 Muir Place Ct
- 3836 Muir Place Ct
- 3820 Muir Place Ct
- 3803 Muir Place Ct
- 3844 Muir Place Ct
- 3842 Deans Place Way
- 3812 Muir Place Ct
- 3806 Deans Place Way
- 3859 Muir Place Ct
- 3852 Muir Place Ct