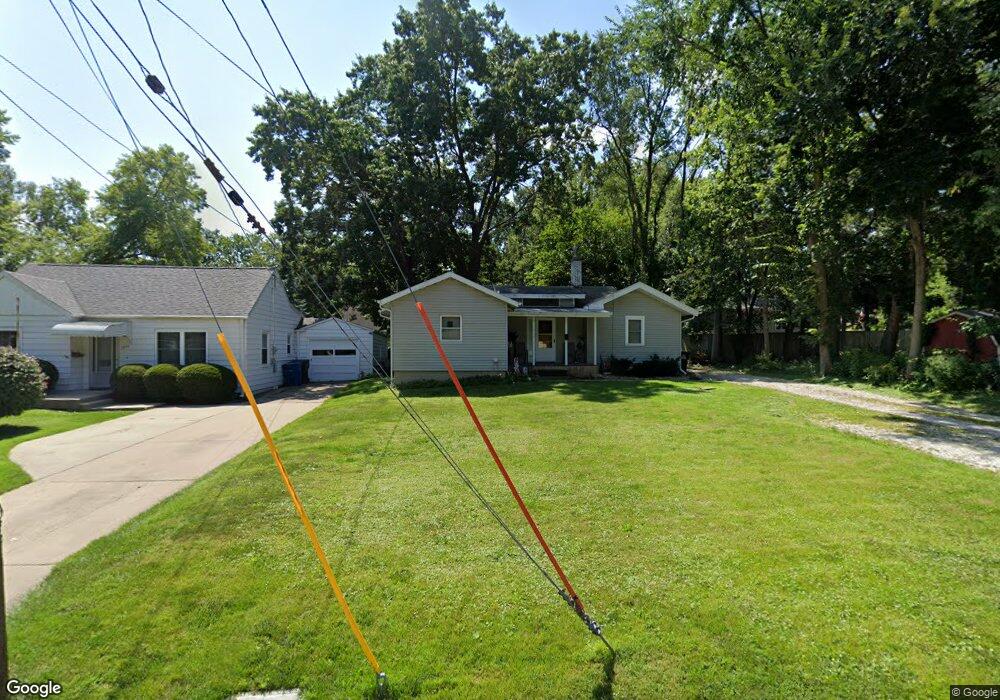
3828 Boston Ave Des Moines, IA 50310
Beaverdale NeighborhoodEstimated Value: $176,000 - $214,000
2
Beds
1
Bath
854
Sq Ft
$223/Sq Ft
Est. Value
About This Home
This home is located at 3828 Boston Ave, Des Moines, IA 50310 and is currently estimated at $190,665, approximately $223 per square foot. 3828 Boston Ave is a home located in Polk County with nearby schools including Moore Elementary School, Meredith Middle School, and Hoover High School.
Ownership History
Date
Name
Owned For
Owner Type
Purchase Details
Closed on
Sep 6, 2013
Sold by
Weieneth Carolyn M
Bought by
Revocab Weieneth Carolyn M and Revocab Carolyn Marie Weieneth
Current Estimated Value
Purchase Details
Closed on
May 15, 2012
Sold by
Carmar Properties Llc
Bought by
Weieneth Carolyn M
Purchase Details
Closed on
Feb 12, 2000
Sold by
Weieneth Carolyn M and Weieneth Marlin W
Bought by
Carmar Properties Llc
Purchase Details
Closed on
Jul 1, 1999
Sold by
Weieneth Marlin and Weieneth Carolyn M
Bought by
Weieneth Carolyn M
Create a Home Valuation Report for This Property
The Home Valuation Report is an in-depth analysis detailing your home's value as well as a comparison with similar homes in the area
Home Values in the Area
Average Home Value in this Area
Purchase History
| Date | Buyer | Sale Price | Title Company |
|---|---|---|---|
| Revocab Weieneth Carolyn M | -- | None Available | |
| Weieneth Carolyn M | -- | None Available | |
| Carmar Properties Llc | -- | -- | |
| Weieneth Carolyn M | -- | -- |
Source: Public Records
Tax History Compared to Growth
Tax History
| Year | Tax Paid | Tax Assessment Tax Assessment Total Assessment is a certain percentage of the fair market value that is determined by local assessors to be the total taxable value of land and additions on the property. | Land | Improvement |
|---|---|---|---|---|
| 2025 | $2,836 | $162,200 | $63,800 | $98,400 |
| 2024 | $2,836 | $144,200 | $56,700 | $87,500 |
| 2023 | $2,944 | $144,200 | $56,700 | $87,500 |
| 2022 | $2,922 | $124,900 | $50,100 | $74,800 |
| 2021 | $2,892 | $124,900 | $50,100 | $74,800 |
| 2020 | $3,004 | $115,900 | $46,800 | $69,100 |
| 2019 | $2,824 | $115,900 | $46,800 | $69,100 |
| 2018 | $2,796 | $105,100 | $41,500 | $63,600 |
| 2017 | $2,548 | $105,100 | $41,500 | $63,600 |
| 2016 | $2,482 | $94,200 | $36,700 | $57,500 |
| 2015 | $2,482 | $94,200 | $36,700 | $57,500 |
| 2014 | $2,420 | $91,100 | $32,600 | $58,500 |
Source: Public Records
Map
Nearby Homes
- 3711 Adams Ave
- 3605 Davisson Rd
- 3514 Davisson Rd
- 3112 Beaver Ave
- 4037 Amick Ave
- 3514 Urbandale Ave
- 2614 40th Place
- 3616 37th St
- 3501 Sheridan Ave
- 4004 Clinton Ave
- 3905 Clinton Ave
- 2500 38th St
- 3215 44th St
- 3301 34th St
- 3711 37th St
- 2421 39th St
- 2419 40th Place
- 4008 Douglas Ave
- 4327 Sheridan Ave
- 4020 Douglas Ave