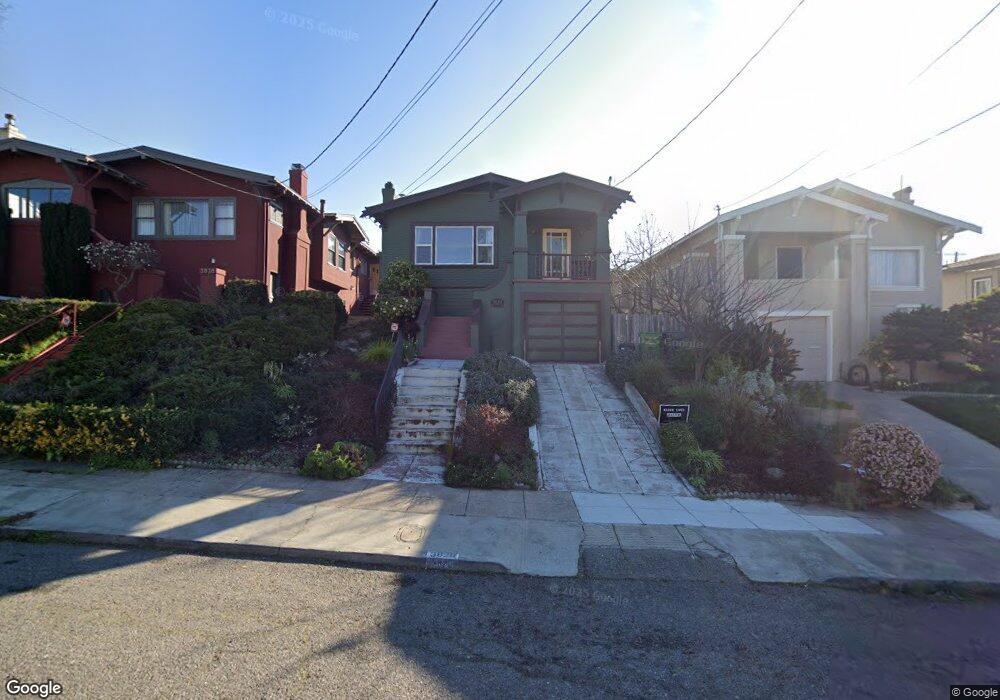
3828 Elston Ave Oakland, CA 94602
Glenview NeighborhoodEstimated Value: $1,057,059 - $1,257,000
2
Beds
1
Bath
1,393
Sq Ft
$827/Sq Ft
Est. Value
About This Home
This home is located at 3828 Elston Ave, Oakland, CA 94602 and is currently estimated at $1,152,265, approximately $827 per square foot. 3828 Elston Ave is a home located in Alameda County with nearby schools including Glenview Elementary School, Edna Brewer Middle School, and Oakland High School.
Ownership History
Date
Name
Owned For
Owner Type
Purchase Details
Closed on
Sep 21, 2010
Sold by
Mckinney Patrick R and Russell Jessica
Bought by
Mckinney Patrick R and Russell Jessica
Current Estimated Value
Purchase Details
Closed on
Nov 17, 2004
Sold by
Wong Pui Man
Bought by
Mckinney Patrick R and Russell Jessica L
Home Financials for this Owner
Home Financials are based on the most recent Mortgage that was taken out on this home.
Original Mortgage
$580,000
Outstanding Balance
$271,745
Interest Rate
4.87%
Mortgage Type
Purchase Money Mortgage
Estimated Equity
$880,520
Purchase Details
Closed on
Jun 21, 2004
Sold by
Eggerts Sharon L and Eggerts Donald W
Bought by
Wong Pui Man
Home Financials for this Owner
Home Financials are based on the most recent Mortgage that was taken out on this home.
Original Mortgage
$344,000
Interest Rate
5.75%
Mortgage Type
Purchase Money Mortgage
Create a Home Valuation Report for This Property
The Home Valuation Report is an in-depth analysis detailing your home's value as well as a comparison with similar homes in the area
Home Values in the Area
Average Home Value in this Area
Purchase History
| Date | Buyer | Sale Price | Title Company |
|---|---|---|---|
| Mckinney Patrick R | -- | None Available | |
| Mckinney Patrick R | $725,000 | Chicago Title Co | |
| Wong Pui Man | $430,000 | Old Republic Title Company |
Source: Public Records
Mortgage History
| Date | Status | Borrower | Loan Amount |
|---|---|---|---|
| Open | Mckinney Patrick R | $580,000 | |
| Previous Owner | Wong Pui Man | $344,000 | |
| Closed | Wong Pui Man | $64,500 | |
| Closed | Mckinney Patrick R | $108,750 |
Source: Public Records
Tax History
| Year | Tax Paid | Tax Assessment Tax Assessment Total Assessment is a certain percentage of the fair market value that is determined by local assessors to be the total taxable value of land and additions on the property. | Land | Improvement |
|---|---|---|---|---|
| 2025 | $14,246 | $1,003,490 | $303,147 | $707,343 |
| 2024 | $14,246 | $983,683 | $297,205 | $693,478 |
| 2023 | $15,029 | $971,260 | $291,378 | $679,882 |
| 2022 | $14,684 | $945,221 | $285,666 | $666,555 |
| 2021 | $14,148 | $926,553 | $280,066 | $653,487 |
| 2020 | $13,994 | $923,983 | $277,195 | $646,788 |
| 2019 | $13,537 | $905,872 | $271,761 | $634,111 |
| 2018 | $13,253 | $888,117 | $266,435 | $621,682 |
| 2017 | $12,772 | $870,710 | $261,213 | $609,497 |
| 2016 | $11,935 | $818,000 | $245,400 | $572,600 |
| 2015 | $10,555 | $709,000 | $212,700 | $496,300 |
| 2014 | $10,089 | $650,000 | $195,000 | $455,000 |
Source: Public Records
Map
Nearby Homes
- 1515 Hampel St
- 3927 Canon Ave
- 1424 Hampel St
- 3525 Dimond Ave
- 4033 Park Blvd
- 4037 Park Blvd
- 1235 Hampel St
- 1233 Hampel St
- 2550 Pleasant St
- 3081 23rd Ave
- 4426 Park Blvd
- 2257 Macarthur Blvd
- 3464 Champion St
- 1374 El Centro Ave
- 1331 Excelsior Ave
- 1210 Everett Ave
- 1458 E 33rd St
- 3226 Champion St
- 3220 Champion St
- 2628 School St
- 3838 Elston Ave
- 3822 Elston Ave
- 3840 Elston Ave
- 3814 Elston Ave
- 3835 Linwood Ave
- 3855 Linwood Ave
- 3827 Linwood Ave
- 3900 Elston Ave
- 3806 Elston Ave
- 3901 Linwood Ave
- 3819 Linwood Ave
- 3905 Linwood Ave
- 3809 Linwood Ave
- 3827 Elston Ave
- 3910 Elston Ave
- 3833 Elston Ave
- 3823 Elston Ave
- 1708 E 38th St
- 3800 Elston Ave
- 3839 Elston Ave
Your Personal Tour Guide
Ask me questions while you tour the home.