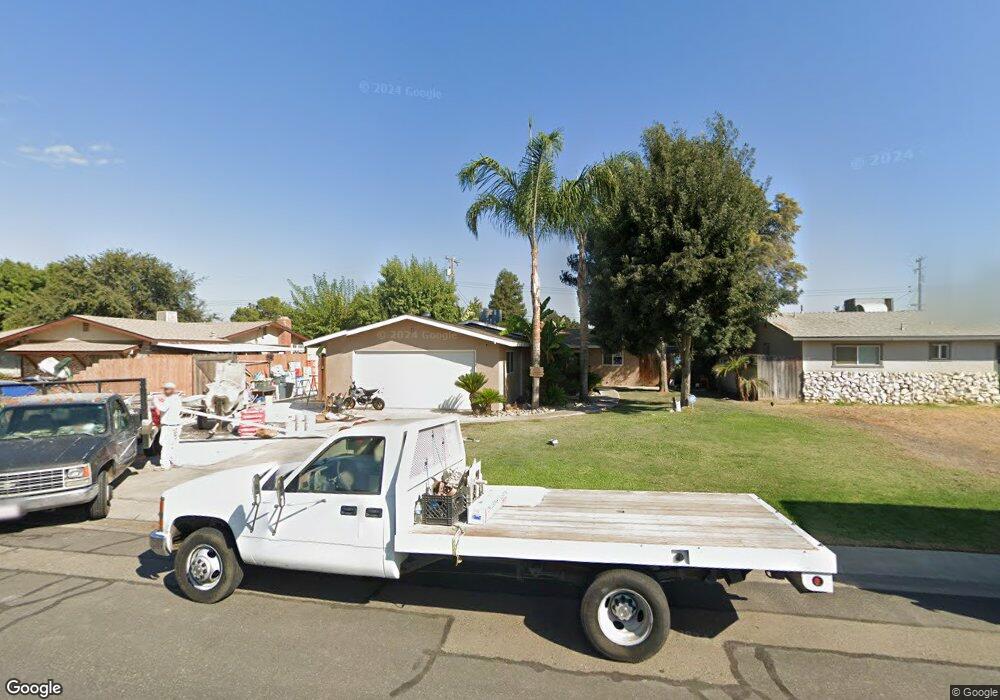
3828 W Judy Ave Visalia, CA 93277
Estimated Value: $312,000 - $359,000
3
Beds
3
Baths
1,254
Sq Ft
$260/Sq Ft
Est. Value
About This Home
This home is located at 3828 W Judy Ave, Visalia, CA 93277 and is currently estimated at $326,402, approximately $260 per square foot. 3828 W Judy Ave is a home located in Tulare County with nearby schools including Veva Blunt Elementary School, La Joya Middle School, and El Diamante High School.
Ownership History
Date
Name
Owned For
Owner Type
Purchase Details
Closed on
Jul 17, 2024
Sold by
Roy Brandon
Bought by
Brandon Roy Revocable Living Trust and Roy
Current Estimated Value
Purchase Details
Closed on
Jun 16, 2005
Sold by
Roy Michael
Bought by
Roy Brandon
Home Financials for this Owner
Home Financials are based on the most recent Mortgage that was taken out on this home.
Original Mortgage
$130,000
Interest Rate
5.58%
Mortgage Type
New Conventional
Purchase Details
Closed on
Aug 14, 1998
Sold by
Federal National Mortgage Association
Bought by
Roy Brandon and Roy Michael J
Home Financials for this Owner
Home Financials are based on the most recent Mortgage that was taken out on this home.
Original Mortgage
$69,864
Interest Rate
6.91%
Mortgage Type
FHA
Purchase Details
Closed on
Mar 10, 1998
Sold by
Marks Roger W and Marks Alice
Bought by
Federal National Mortgage Association
Purchase Details
Closed on
May 10, 1994
Sold by
Hagman Harold
Bought by
Leoni Glenda Ann
Create a Home Valuation Report for This Property
The Home Valuation Report is an in-depth analysis detailing your home's value as well as a comparison with similar homes in the area
Home Values in the Area
Average Home Value in this Area
Purchase History
| Date | Buyer | Sale Price | Title Company |
|---|---|---|---|
| Brandon Roy Revocable Living Trust | -- | None Listed On Document | |
| Roy Brandon | -- | First American Title Ins Co | |
| Roy Brandon | -- | Chicago Title Co | |
| Federal National Mortgage Association | $78,263 | -- | |
| Leoni Glenda Ann | -- | -- | |
| Hagman Harold | -- | -- |
Source: Public Records
Mortgage History
| Date | Status | Borrower | Loan Amount |
|---|---|---|---|
| Previous Owner | Roy Brandon | $130,000 | |
| Previous Owner | Roy Brandon | $69,864 |
Source: Public Records
Tax History Compared to Growth
Tax History
| Year | Tax Paid | Tax Assessment Tax Assessment Total Assessment is a certain percentage of the fair market value that is determined by local assessors to be the total taxable value of land and additions on the property. | Land | Improvement |
|---|---|---|---|---|
| 2025 | $2,413 | $235,860 | $91,843 | $144,017 |
| 2024 | $2,413 | $231,237 | $90,043 | $141,194 |
| 2023 | $2,345 | $226,704 | $88,278 | $138,426 |
| 2022 | $2,271 | $222,260 | $86,548 | $135,712 |
| 2021 | $2,168 | $211,000 | $53,000 | $158,000 |
| 2020 | $2,252 | $218,519 | $50,000 | $168,519 |
| 2019 | $2,055 | $201,836 | $46,000 | $155,836 |
| 2018 | $1,881 | $186,306 | $43,000 | $143,306 |
| 2017 | $1,695 | $166,915 | $38,000 | $128,915 |
| 2016 | $1,576 | $155,650 | $36,000 | $119,650 |
| 2015 | $1,494 | $148,600 | $34,000 | $114,600 |
| 2014 | $1,494 | $147,178 | $30,000 | $117,178 |
Source: Public Records
Map
Nearby Homes
- 3804 W Judy Ave
- 3708 W Paradise Ave
- 1937 S Royal Oaks Dr
- 4024 W Howard Ave
- 3515 W Iris Ave
- 3924 W Fairhaven Ave
- 3504 W Cutler Ave
- 1834 S Redwood St
- 3425 W Laurel Ave
- 3125 W Howard Ave
- 4438 W Feemster Ave
- 3124 W Tulare Ave
- 1127 S Whitney Dr
- 2921 W Cornell Ave
- 820 S Chinowth St Unit 93
- 820 S Chinowth St Unit 102
- 820 S Chinowth St
- 820 S Chinowth St Unit 74
- 820 S Chinowth St Unit 98
- 820 S Chinowth St Unit 70
- 3814 W Judy Ave
- 3842 W Judy Ave
- 3829 W Paradise Ave
- 3900 W Judy Ave
- 3843 W Paradise Ave
- 3815 W Paradise Ave
- 3805 W Paradise Ave
- 3835 W Judy Ave
- 3901 W Paradise Ave
- 3819 W Judy Ave
- 3742 W Judy Ave
- 3910 W Judy Ave
- 3847 W Judy Ave
- 3807 W Judy Ave
- 3743 W Paradise Ave
- 3911 W Paradise Ave
- 3905 W Judy Ave
- 3747 W Judy Ave
- 3730 W Judy Ave
- 3920 W Judy Ave