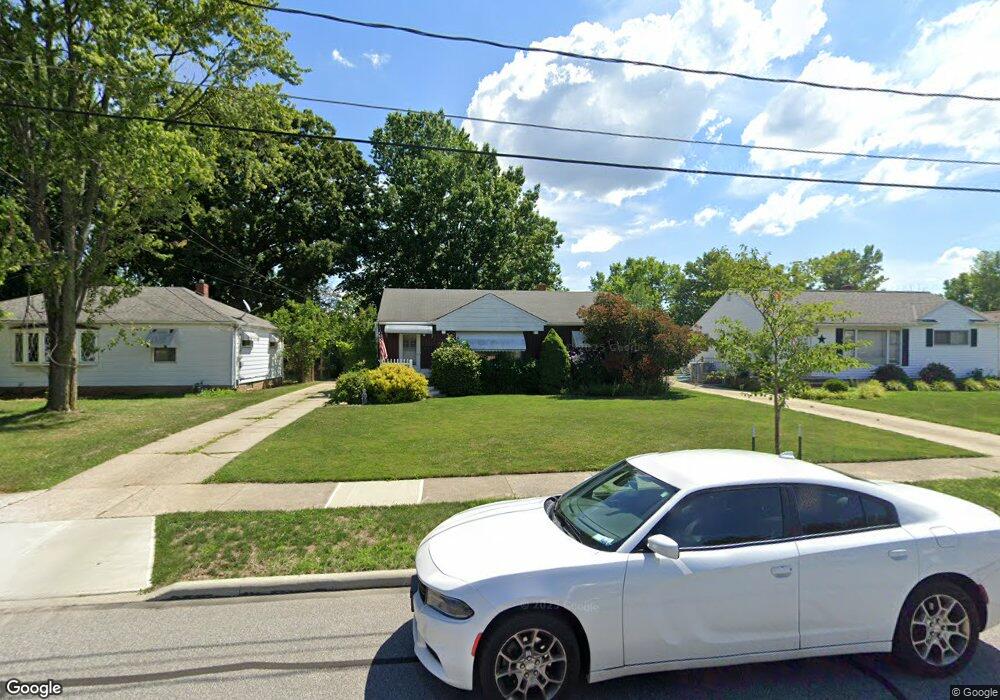
3829 Harvard Dr Willoughby, OH 44094
Estimated Value: $165,615 - $201,000
3
Beds
1
Bath
960
Sq Ft
$191/Sq Ft
Est. Value
About This Home
This home is located at 3829 Harvard Dr, Willoughby, OH 44094 and is currently estimated at $183,404, approximately $191 per square foot. 3829 Harvard Dr is a home located in Lake County with nearby schools including Grant Elementary School, Willoughby Middle School, and South High School.
Ownership History
Date
Name
Owned For
Owner Type
Purchase Details
Closed on
Jan 18, 2017
Sold by
Kordes Jason A
Bought by
Kordes Jason A
Current Estimated Value
Home Financials for this Owner
Home Financials are based on the most recent Mortgage that was taken out on this home.
Original Mortgage
$73,590
Outstanding Balance
$48,598
Interest Rate
3.94%
Mortgage Type
New Conventional
Estimated Equity
$134,806
Purchase Details
Closed on
Aug 23, 2002
Sold by
Mathe Dorothy H
Bought by
Kordes Jason A and Kordes Jacqueline M
Home Financials for this Owner
Home Financials are based on the most recent Mortgage that was taken out on this home.
Original Mortgage
$107,910
Interest Rate
5.98%
Mortgage Type
Balloon
Purchase Details
Closed on
Aug 31, 2001
Sold by
Estate Of Joseph Mathe
Bought by
Mathe Dorothy H
Purchase Details
Closed on
Jan 1, 1990
Bought by
Mathe Joseph M
Create a Home Valuation Report for This Property
The Home Valuation Report is an in-depth analysis detailing your home's value as well as a comparison with similar homes in the area
Home Values in the Area
Average Home Value in this Area
Purchase History
| Date | Buyer | Sale Price | Title Company |
|---|---|---|---|
| Kordes Jason A | -- | None Available | |
| Kordes Jason A | $119,900 | Enterprise Title | |
| Mathe Dorothy H | -- | -- | |
| Mathe Joseph M | -- | -- |
Source: Public Records
Mortgage History
| Date | Status | Borrower | Loan Amount |
|---|---|---|---|
| Open | Kordes Jason A | $73,590 | |
| Closed | Kordes Jason A | $107,910 |
Source: Public Records
Tax History Compared to Growth
Tax History
| Year | Tax Paid | Tax Assessment Tax Assessment Total Assessment is a certain percentage of the fair market value that is determined by local assessors to be the total taxable value of land and additions on the property. | Land | Improvement |
|---|---|---|---|---|
| 2024 | -- | $51,360 | $18,180 | $33,180 |
| 2023 | $2,430 | $37,910 | $14,100 | $23,810 |
| 2022 | $2,347 | $37,910 | $14,100 | $23,810 |
| 2021 | $2,789 | $37,910 | $14,100 | $23,810 |
| 2020 | $2,842 | $33,850 | $12,590 | $21,260 |
| 2019 | $2,719 | $33,850 | $12,590 | $21,260 |
| 2018 | $2,647 | $30,910 | $12,590 | $18,320 |
| 2017 | $2,551 | $30,910 | $12,590 | $18,320 |
| 2016 | $2,509 | $30,910 | $12,590 | $18,320 |
| 2015 | $2,012 | $30,910 | $12,590 | $18,320 |
| 2014 | $1,813 | $29,340 | $12,590 | $16,750 |
| 2013 | $1,814 | $29,340 | $12,590 | $16,750 |
Source: Public Records
Map
Nearby Homes
- 3780 E 364th St
- 36843 Stevens Blvd
- 1270 E 362nd St
- 1222 E 360th St
- 1057 Valley Creek Dr
- 35821 Meyer Ave
- 36842 Saint Clair St
- 36765 Garretts Cove Dr
- 847 Audrey Dr
- 37584 Ocean Reef
- 988 E 348th St
- 3680 Foothill Blvd
- VL Foothill Blvd
- 38125 Highgate Bluff Ln
- 911 E 346th St
- 34622 Iris Ln
- 37842 Park Ave
- 34440 Glen Dr
- 38063 Euclid Ave
- 1271 Hulett Ave
- 3837 Harvard Dr
- 3819 Harvard Dr
- 3847 Harvard Dr
- 3809 Harvard Dr
- 3855 Harvard Dr
- 3830 Harvard Dr
- 3838 Harvard Dr
- 3820 Harvard Dr
- 3848 Harvard Dr
- 3814 Harvard Dr
- 3805 Harvard Dr
- 3865 Harvard Dr
- 3801 Harvard Dr
- 3856 Harvard Dr
- 3808 Harvard Dr
- 3875 Harvard Dr
- 3866 Harvard Dr
- 3829 E 365th St
- 3804 Harvard Dr
- 3839 E 365th St