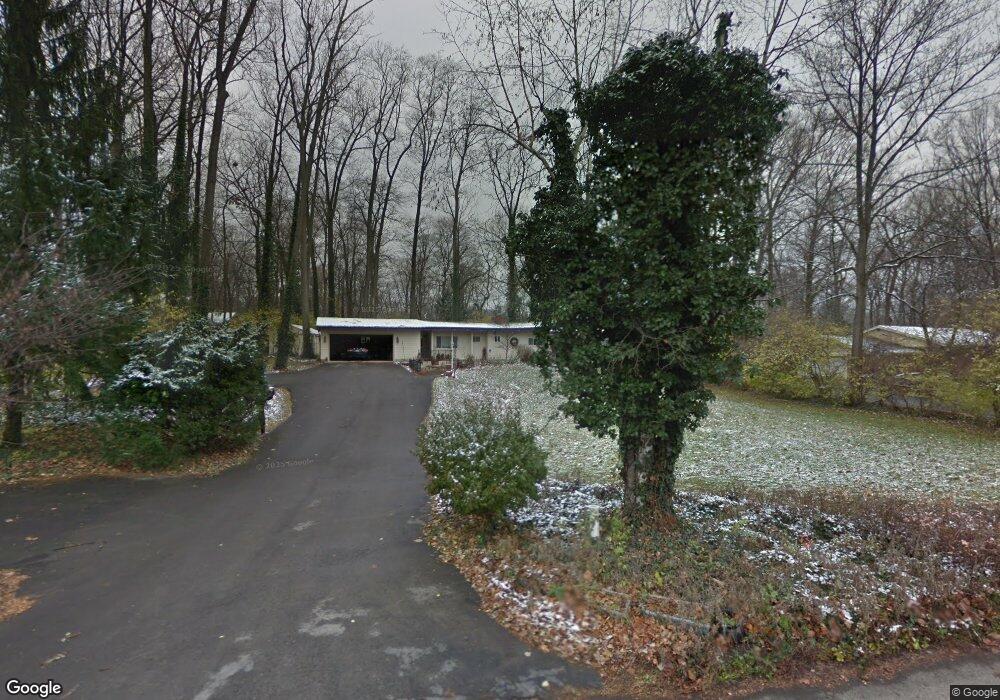
3829 Lenox Dr Dayton, OH 45429
Estimated Value: $288,000 - $328,000
3
Beds
2
Baths
1,308
Sq Ft
$233/Sq Ft
Est. Value
About This Home
This home is located at 3829 Lenox Dr, Dayton, OH 45429 and is currently estimated at $305,293, approximately $233 per square foot. 3829 Lenox Dr is a home located in Montgomery County with nearby schools including Southdale Elementary School, Van Buren Middle School, and Kettering Fairmont High School.
Ownership History
Date
Name
Owned For
Owner Type
Purchase Details
Closed on
Dec 9, 2020
Sold by
Blanzy Timothy M and Blanzy Christina
Bought by
Mclean James T
Current Estimated Value
Purchase Details
Closed on
Jan 26, 2017
Sold by
Bourne James R and Bourne Helen S
Bought by
Jeff Adriane J and Bourne Leslie Ann
Home Financials for this Owner
Home Financials are based on the most recent Mortgage that was taken out on this home.
Original Mortgage
$191,105
Interest Rate
3.7%
Mortgage Type
VA
Purchase Details
Closed on
Jan 11, 2017
Sold by
Jett Adriane S and Bourne Leslie Ann
Bought by
Blanzy Timothy M
Home Financials for this Owner
Home Financials are based on the most recent Mortgage that was taken out on this home.
Original Mortgage
$191,105
Interest Rate
3.7%
Mortgage Type
VA
Purchase Details
Closed on
Sep 30, 1993
Sold by
Dickinson Robert P
Bought by
Bourne James R and Bourne Helen S
Create a Home Valuation Report for This Property
The Home Valuation Report is an in-depth analysis detailing your home's value as well as a comparison with similar homes in the area
Home Values in the Area
Average Home Value in this Area
Purchase History
| Date | Buyer | Sale Price | Title Company |
|---|---|---|---|
| Mclean James T | $212,000 | Home Services Title Llc | |
| Jeff Adriane J | -- | None Available | |
| Blanzy Timothy M | $185,000 | Fidelity Lawyers Ttl Agcy Ll | |
| Bourne James R | -- | -- |
Source: Public Records
Mortgage History
| Date | Status | Borrower | Loan Amount |
|---|---|---|---|
| Previous Owner | Blanzy Timothy M | $191,105 |
Source: Public Records
Tax History Compared to Growth
Tax History
| Year | Tax Paid | Tax Assessment Tax Assessment Total Assessment is a certain percentage of the fair market value that is determined by local assessors to be the total taxable value of land and additions on the property. | Land | Improvement |
|---|---|---|---|---|
| 2024 | $4,852 | $87,460 | $32,290 | $55,170 |
| 2023 | $4,852 | $87,460 | $32,290 | $55,170 |
| 2022 | $4,143 | $61,590 | $22,740 | $38,850 |
| 2021 | $3,832 | $61,590 | $22,740 | $38,850 |
| 2020 | $4,576 | $61,590 | $22,740 | $38,850 |
| 2019 | $4,742 | $56,450 | $22,740 | $33,710 |
| 2018 | $4,768 | $56,450 | $22,740 | $33,710 |
| 2017 | $3,633 | $56,450 | $22,740 | $33,710 |
| 2016 | $3,349 | $50,050 | $22,740 | $27,310 |
| 2015 | $3,199 | $50,050 | $22,740 | $27,310 |
| 2014 | $3,199 | $50,050 | $22,740 | $27,310 |
| 2012 | -- | $56,390 | $23,100 | $33,290 |
Source: Public Records
Map
Nearby Homes
- 305 Glenridge Rd
- 115 N Bromfield Rd
- 298 Marchester Dr
- 3212 Lenox Dr
- 3325 Ridgeway Rd
- 604 Schuyler Dr
- 101 Blue Gate Cir Unit 1
- 3993 Applewood Ln
- 645 Brookfield Rd
- 4241 Schrubb Dr
- 117 Cushing Ave
- 503 Cottingwood Ct
- 4259 Maxlin Rd
- 3073 Hillside Ave
- 311 Parkdale St Unit 309
- 424 Cushing Ave
- 309 Lewiston Rd
- 441 Cushing Ave
- 587 Cottingwood Ct
- 320 E Dorothy Ln