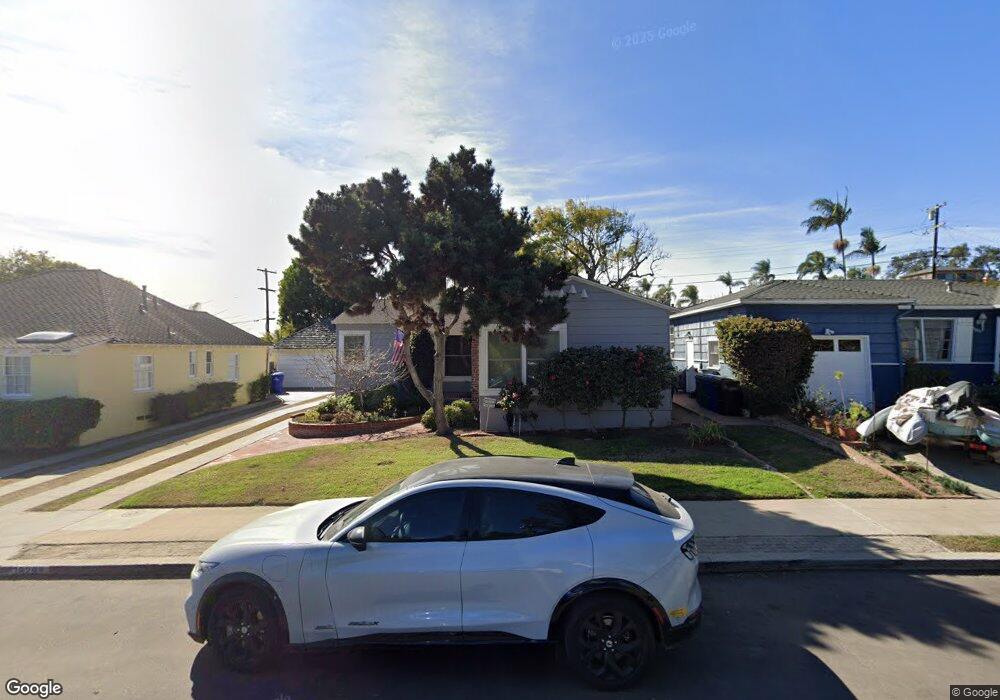
3829 Narragansett Ave San Diego, CA 92107
Point Loma Heights NeighborhoodEstimated Value: $1,357,000 - $1,596,367
3
Beds
2
Baths
1,287
Sq Ft
$1,127/Sq Ft
Est. Value
About This Home
This home is located at 3829 Narragansett Ave, San Diego, CA 92107 and is currently estimated at $1,451,092, approximately $1,127 per square foot. 3829 Narragansett Ave is a home located in San Diego County with nearby schools including Richard Henry Dana Middle School, Silver Gate Elementary School, and Correia Middle School.
Ownership History
Date
Name
Owned For
Owner Type
Purchase Details
Closed on
Sep 8, 2015
Sold by
Vamos Stephanie
Bought by
Ford Jonathan M and Goodacre Ashley K
Current Estimated Value
Home Financials for this Owner
Home Financials are based on the most recent Mortgage that was taken out on this home.
Original Mortgage
$590,000
Outstanding Balance
$463,406
Interest Rate
3.91%
Mortgage Type
New Conventional
Estimated Equity
$987,686
Purchase Details
Closed on
Jun 4, 2012
Sold by
Vamos Gregory C
Bought by
Vamos Stephanie
Purchase Details
Closed on
Apr 18, 2008
Sold by
Vamos George L
Bought by
Vamos George L
Purchase Details
Closed on
Oct 23, 2000
Sold by
Bergman Ellen I Trust 02-15-94 and Bergman Barbara
Bought by
Vamos George L
Home Financials for this Owner
Home Financials are based on the most recent Mortgage that was taken out on this home.
Original Mortgage
$324,000
Interest Rate
7.82%
Purchase Details
Closed on
Feb 15, 1994
Sold by
Bergman Ellen I
Bought by
Bergman Ellen I
Create a Home Valuation Report for This Property
The Home Valuation Report is an in-depth analysis detailing your home's value as well as a comparison with similar homes in the area
Home Values in the Area
Average Home Value in this Area
Purchase History
| Date | Buyer | Sale Price | Title Company |
|---|---|---|---|
| Ford Jonathan M | $737,500 | Corinthian Title Company | |
| Vamos Stephanie | -- | None Available | |
| Vamos George L | -- | None Available | |
| Vamos George L | $405,000 | First American Title | |
| Bergman Ellen I | -- | -- |
Source: Public Records
Mortgage History
| Date | Status | Borrower | Loan Amount |
|---|---|---|---|
| Open | Ford Jonathan M | $590,000 | |
| Previous Owner | Vamos George L | $324,000 |
Source: Public Records
Tax History Compared to Growth
Tax History
| Year | Tax Paid | Tax Assessment Tax Assessment Total Assessment is a certain percentage of the fair market value that is determined by local assessors to be the total taxable value of land and additions on the property. | Land | Improvement |
|---|---|---|---|---|
| 2025 | $10,546 | $873,042 | $754,494 | $118,548 |
| 2024 | $10,546 | $855,924 | $739,700 | $116,224 |
| 2023 | $10,314 | $839,143 | $725,197 | $113,946 |
| 2022 | $10,040 | $822,690 | $710,978 | $111,712 |
| 2021 | $9,971 | $806,560 | $697,038 | $109,522 |
| 2020 | $9,850 | $798,290 | $689,891 | $108,399 |
| 2019 | $9,675 | $782,638 | $676,364 | $106,274 |
| 2018 | $9,045 | $767,293 | $663,102 | $104,191 |
| 2017 | $8,830 | $752,249 | $650,100 | $102,149 |
| 2016 | $8,690 | $737,500 | $637,353 | $100,147 |
| 2015 | $5,994 | $507,767 | $438,816 | $68,951 |
| 2014 | $5,900 | $497,822 | $430,221 | $67,601 |
Source: Public Records
Map
Nearby Homes
- 3742 Wildwood Rd
- 3985 La Cresta Dr
- 3733 La Cresta Dr
- 3761 La Cresta Dr
- 3777 Poe St
- 3951 Atascadero Dr
- 3717 Poe St
- 1980 Chatsworth Blvd
- 3614 Wawona Dr
- 1988 Catalina Blvd Unit A B C
- 3805 Atascadero Dr
- 1501 Chatsworth Blvd
- 4303 Del Mar Ave
- 4386 Niagara Ave
- 4377 Newport Ave
- 3428 Garrison St
- 3585 Addison St
- 3412 Poe St
- 3428 Quimby St
- 2126 San Clemente St
- 3819 Narragansett Ave
- 3835 Narragansett Ave
- 3845 Narragansett Ave
- 1786 Warrington St
- 3828 Milan St
- 3838 Milan St
- 3820 Milan St
- 3853 Narragansett Ave
- 3844 Milan St
- 1770 Warrington St
- 4003 Narragansett Ave
- 3802 Narragansett Ave
- 1760 Warrington St
- 3904 Milan St
- 4011 Narragansett Ave
- 1791 Warrington St
- 3860 Narragansett Ave
- 3912 Milan St
- 3794 Milan St
- 4019 Narragansett Ave