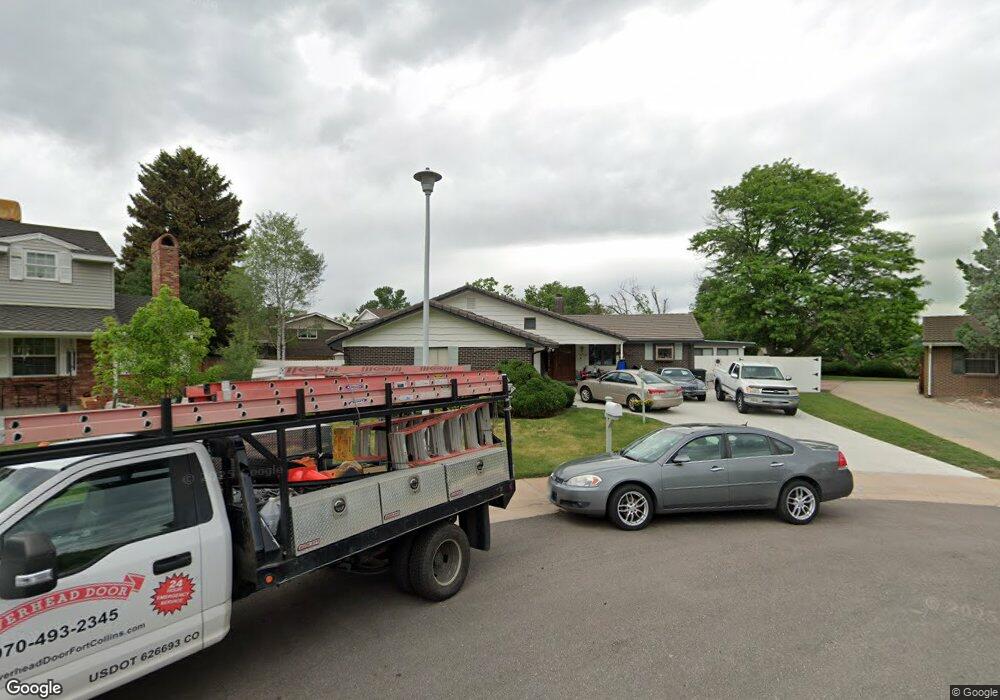
3829 S Chase St Denver, CO 80235
Fort Logan NeighborhoodEstimated Value: $745,000 - $998,000
4
Beds
3
Baths
1,547
Sq Ft
$534/Sq Ft
Est. Value
About This Home
This home is located at 3829 S Chase St, Denver, CO 80235 and is currently estimated at $826,438, approximately $534 per square foot. 3829 S Chase St is a home located in Denver County with nearby schools including Sabin World School, Bear Valley International School, and John F Kennedy High School.
Ownership History
Date
Name
Owned For
Owner Type
Purchase Details
Closed on
Aug 17, 2007
Sold by
Conca David C and Conca Joanne C
Bought by
Lynch Jerry K
Current Estimated Value
Home Financials for this Owner
Home Financials are based on the most recent Mortgage that was taken out on this home.
Original Mortgage
$355,000
Outstanding Balance
$224,538
Interest Rate
6.64%
Mortgage Type
VA
Estimated Equity
$601,900
Purchase Details
Closed on
May 30, 2007
Sold by
Nelson Sharon L
Bought by
Nelson David P
Purchase Details
Closed on
May 25, 2007
Sold by
Nelson David P
Bought by
Conca David C and Conca Joanne C
Purchase Details
Closed on
Sep 9, 2004
Sold by
Sanchez Cruz D
Bought by
Nelson Sharon L
Home Financials for this Owner
Home Financials are based on the most recent Mortgage that was taken out on this home.
Original Mortgage
$307,200
Interest Rate
6.99%
Mortgage Type
Purchase Money Mortgage
Purchase Details
Closed on
Jun 15, 2001
Sold by
Kilpatrick Ann S
Bought by
Sanchez Cruz D
Create a Home Valuation Report for This Property
The Home Valuation Report is an in-depth analysis detailing your home's value as well as a comparison with similar homes in the area
Home Values in the Area
Average Home Value in this Area
Purchase History
| Date | Buyer | Sale Price | Title Company |
|---|---|---|---|
| Lynch Jerry K | $355,000 | Utc Colorado | |
| Nelson David P | -- | None Available | |
| Conca David C | $305,000 | Utc Colorado | |
| Nelson Sharon L | $384,000 | Title America | |
| Sanchez Cruz D | -- | -- |
Source: Public Records
Mortgage History
| Date | Status | Borrower | Loan Amount |
|---|---|---|---|
| Open | Lynch Jerry K | $355,000 | |
| Previous Owner | Nelson Sharon L | $307,200 | |
| Closed | Nelson Sharon L | $76,800 |
Source: Public Records
Tax History Compared to Growth
Tax History
| Year | Tax Paid | Tax Assessment Tax Assessment Total Assessment is a certain percentage of the fair market value that is determined by local assessors to be the total taxable value of land and additions on the property. | Land | Improvement |
|---|---|---|---|---|
| 2024 | $3,557 | $51,610 | $7,790 | $43,820 |
| 2023 | $3,480 | $51,610 | $7,790 | $43,820 |
| 2022 | $2,671 | $40,540 | $11,900 | $28,640 |
| 2021 | $2,579 | $41,710 | $12,240 | $29,470 |
| 2020 | $2,161 | $36,280 | $11,230 | $25,050 |
| 2019 | $2,101 | $36,280 | $11,230 | $25,050 |
| 2018 | $1,793 | $30,370 | $10,270 | $20,100 |
| 2017 | $2,343 | $30,370 | $10,270 | $20,100 |
| 2016 | $2,668 | $32,720 | $10,221 | $22,499 |
| 2015 | $2,556 | $32,720 | $10,221 | $22,499 |
| 2014 | $2,430 | $29,260 | $9,353 | $19,907 |
Source: Public Records
Map
Nearby Homes
- 3792 S Fenton Way
- 3666 S Depew St Unit 301
- 3663 S Sheridan Blvd Unit A9
- 3663 S Sheridan Blvd Unit J12
- 3663 S Sheridan Blvd Unit 14
- 3811 S Ames St
- 3558 S Depew St Unit 302
- 3656 S Depew St Unit 305
- 3656 S Depew St Unit 104
- 3586 S Depew St Unit 205
- 3586 S Depew St Unit 306
- 3643 S Sheridan Blvd Unit 12
- 3701 S Harlan St
- 5935 W Mansfield Ave Unit 255
- 3623 S Sheridan Blvd Unit 11
- 3623 S Sheridan Blvd Unit 17
- 3623 S Sheridan Blvd Unit 14
- 3623 S Sheridan Blvd Unit 12
- 6055 W Keene Ave
- 3550 S Harlan St Unit 335
- 3833 S Chase St
- 3828 S Eaton St
- 3825 S Chase St
- 3826 S Eaton St
- 3816 S Eaton St
- 3832 S Eaton St
- 3819 S Chase St
- 5590 W Lehigh Ave
- 3837 S Chase St
- 5630 W Lehigh Ave
- 3810 S Eaton St
- 5560 W Lehigh Ave
- 3834 S Eaton St
- 5660 W Lehigh Ave
- 3813 S Chase St
- 3825 S Eaton St
- 5540 W Lehigh Ave
- 3815 S Eaton St
- 5690 W Lehigh Ave
- 5609 W Milan Place