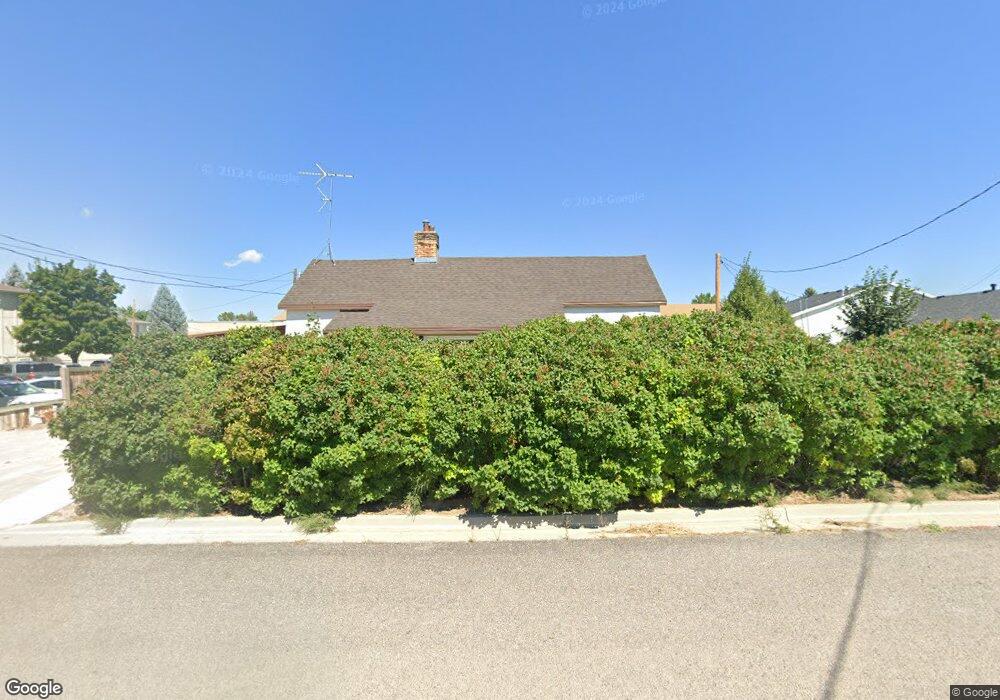
383 E 100 S Ephraim, UT 84627
Estimated Value: $273,939 - $364,000
3
Beds
1
Bath
1,512
Sq Ft
$202/Sq Ft
Est. Value
About This Home
This home is located at 383 E 100 S, Ephraim, UT 84627 and is currently estimated at $305,235, approximately $201 per square foot. 383 E 100 S is a home located in Sanpete County.
Ownership History
Date
Name
Owned For
Owner Type
Purchase Details
Closed on
Aug 21, 2024
Sold by
Cox Rachelle
Bought by
Carlson Reginald W
Current Estimated Value
Purchase Details
Closed on
Dec 20, 2023
Sold by
Green Matthew G
Bought by
Johnson Edwin and Cox Rachelle
Purchase Details
Closed on
Sep 29, 2010
Sold by
Green Matthew G
Bought by
Green Matthew G and Green Glen R
Purchase Details
Closed on
Sep 10, 2010
Sold by
Green Glen R
Bought by
Green Matthew G
Purchase Details
Closed on
Mar 19, 2007
Sold by
Green Matthew G
Bought by
Green Matthew G and Green Glen R
Purchase Details
Closed on
Mar 2, 2006
Sold by
Peterson Matthew J and Peterson Jennifer L
Bought by
Green Matthew G
Create a Home Valuation Report for This Property
The Home Valuation Report is an in-depth analysis detailing your home's value as well as a comparison with similar homes in the area
Home Values in the Area
Average Home Value in this Area
Purchase History
| Date | Buyer | Sale Price | Title Company |
|---|---|---|---|
| Carlson Reginald W | -- | Central Utah Title | |
| Johnson Edwin | -- | -- | |
| Green Matthew G | -- | -- | |
| Green Matthew G | -- | -- | |
| Green Matthew G | -- | Central Utah Title | |
| Green Matthew G | -- | -- |
Source: Public Records
Tax History
| Year | Tax Paid | Tax Assessment Tax Assessment Total Assessment is a certain percentage of the fair market value that is determined by local assessors to be the total taxable value of land and additions on the property. | Land | Improvement |
|---|---|---|---|---|
| 2025 | $1,231 | $119,280 | $0 | $0 |
| 2024 | $1,225 | $112,814 | $0 | $0 |
| 2023 | $1,189 | $104,228 | $0 | $0 |
| 2022 | $1,153 | $92,043 | $0 | $0 |
| 2021 | $1,132 | $78,152 | $0 | $0 |
| 2020 | $1,060 | $68,856 | $0 | $0 |
| 2019 | $1,005 | $64,240 | $0 | $0 |
| 2018 | $907 | $101,564 | $31,086 | $70,478 |
| 2017 | $757 | $48,811 | $0 | $0 |
| 2016 | $709 | $45,746 | $0 | $0 |
| 2015 | $713 | $45,746 | $0 | $0 |
| 2014 | $701 | $45,746 | $0 | $0 |
| 2013 | $698 | $45,746 | $0 | $0 |
Source: Public Records
Map
Nearby Homes
