Estimated Value: $133,094
Studio
--
Bath
40
Sq Ft
$3,327/Sq Ft
Est. Value
About This Home
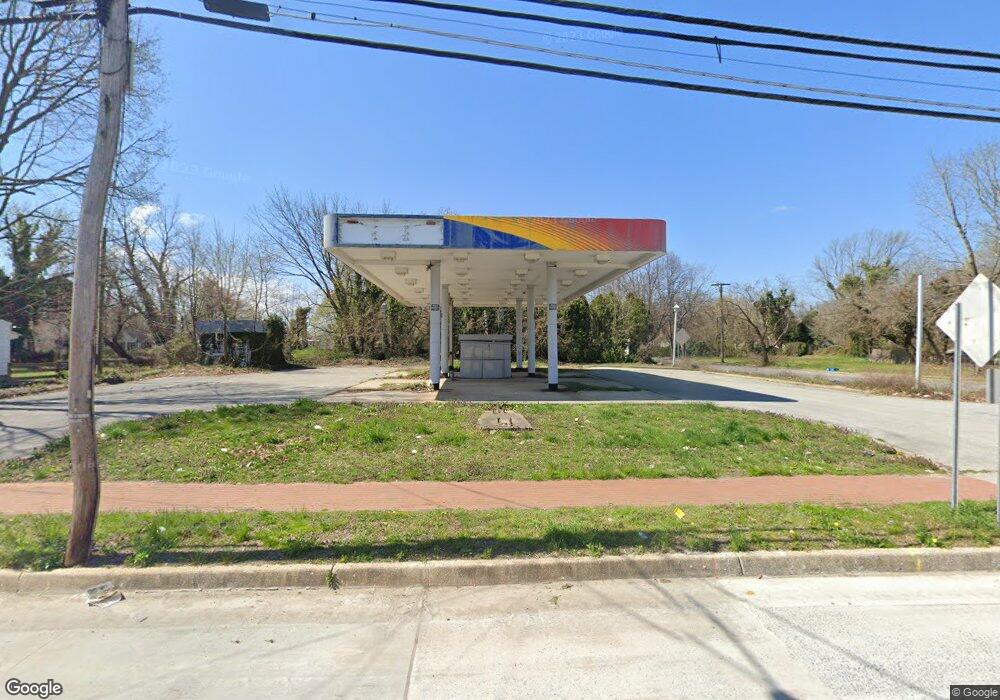
This home is located at 383 E Broadway, Salem, NJ 08079 and is currently estimated at $133,094, approximately $3,327 per square foot. 383 E Broadway is a home located in Salem County with nearby schools including John Fenwick Elementary School, Salem Middle School, and Salem High School.
Ownership History
Date
Name
Owned For
Owner Type
Purchase Details
Closed on
Jul 16, 2009
Sold by
Cei Llc
Bought by
Wood Dean R
Current Estimated Value
Home Financials for this Owner
Home Financials are based on the most recent Mortgage that was taken out on this home.
Original Mortgage
$65,000
Outstanding Balance
$54,674
Interest Rate
12.5%
Mortgage Type
Purchase Money Mortgage
Estimated Equity
$77,181
Purchase Details
Closed on
Oct 27, 1997
Sold by
Fogg Ross
Bought by
Sun Company Inc R&M
Create a Home Valuation Report for This Property
The Home Valuation Report is an in-depth analysis detailing your home's value as well as a comparison with similar homes in the area
Home Values in the Area
Average Home Value in this Area
Purchase History
| Date | Buyer | Sale Price | Title Company |
|---|---|---|---|
| Wood Dean R | $70,000 | -- | |
| Sun Company Inc R&M | $200,000 | Chicago Title Insurance Co |
Source: Public Records
Mortgage History
| Date | Status | Borrower | Loan Amount |
|---|---|---|---|
| Open | Wood Dean R | $65,000 |
Source: Public Records
Tax History
| Year | Tax Paid | Tax Assessment Tax Assessment Total Assessment is a certain percentage of the fair market value that is determined by local assessors to be the total taxable value of land and additions on the property. | Land | Improvement |
|---|---|---|---|---|
| 2025 | $7,609 | $96,800 | $89,600 | $7,200 |
| 2024 | $7,609 | $96,800 | $89,600 | $7,200 |
Source: Public Records
Map
Nearby Homes
- 385 E Broadway Unit 387
- 387 E Broadway
- 380 E Broadway
- 378 E Broadway Unit 380
- 389 E Broadway
- 376 E Broadway
- 382 E Broadway
- 382 E Broadway Unit 1
- 382 UNIT 1 E Broadway
- 382 E Broadway Unit A
- 382 E Broadway Unit B
- 382 E Broadway Unit 2
- 393 E Broadway
- 375 E Broadway
- 18 Linden St
- 18 Fogg Rd
- 382 E East Broadway Unit 2
- 382 E East Broadway Unit 1
- 395 E Broadway
- 9 Davis Ave
Your Personal Tour Guide
Ask me questions while you tour the home.