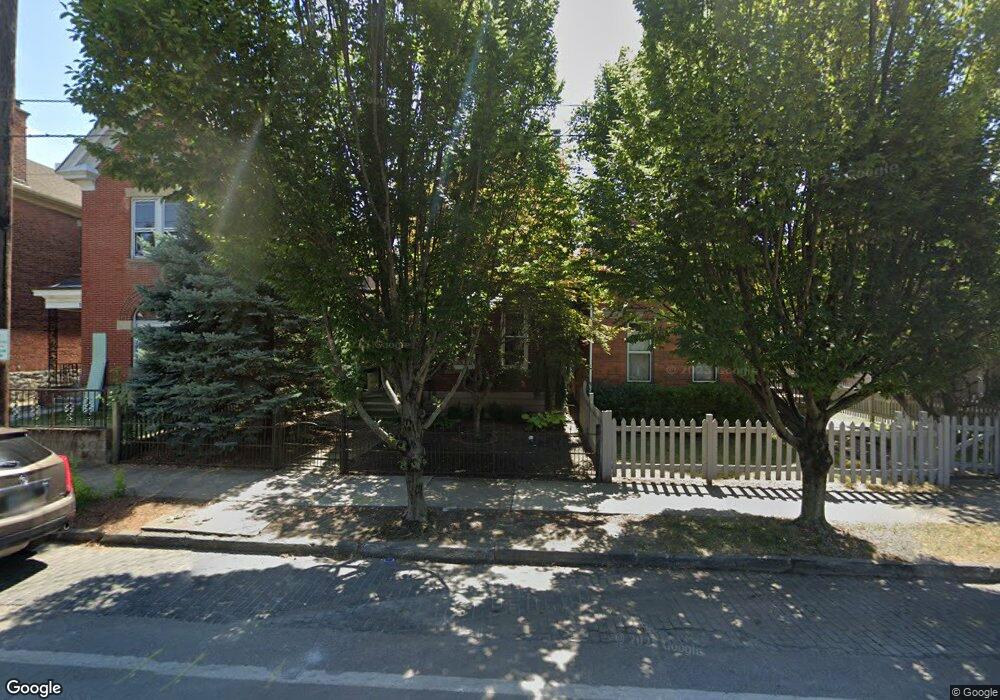
383 E Whittier St Columbus, OH 43206
Schumacher Place NeighborhoodEstimated Value: $428,000 - $548,000
3
Beds
2
Baths
1,959
Sq Ft
$246/Sq Ft
Est. Value
About This Home
This home is located at 383 E Whittier St, Columbus, OH 43206 and is currently estimated at $482,283, approximately $246 per square foot. 383 E Whittier St is a home located in Franklin County with nearby schools including Siebert Elementary School, South High School, and South Columbus Preparatory Academy.
Ownership History
Date
Name
Owned For
Owner Type
Purchase Details
Closed on
Dec 5, 2006
Sold by
Nyers Stephanie
Bought by
Nyers Stephanie
Current Estimated Value
Purchase Details
Closed on
Apr 1, 2002
Sold by
Nyers Stephanie and Nyers Peter
Bought by
Nyers Stephanie
Purchase Details
Closed on
Mar 27, 2000
Sold by
Nyers Stephanie
Bought by
Nyers Stephanie and Schumacher Peter
Home Financials for this Owner
Home Financials are based on the most recent Mortgage that was taken out on this home.
Original Mortgage
$136,000
Interest Rate
8.39%
Purchase Details
Closed on
Jun 13, 1996
Sold by
Sauer Matthew V
Bought by
Farish Timothy J and Farish Susan K
Home Financials for this Owner
Home Financials are based on the most recent Mortgage that was taken out on this home.
Original Mortgage
$120,360
Interest Rate
8.05%
Mortgage Type
VA
Purchase Details
Closed on
Mar 27, 1991
Create a Home Valuation Report for This Property
The Home Valuation Report is an in-depth analysis detailing your home's value as well as a comparison with similar homes in the area
Home Values in the Area
Average Home Value in this Area
Purchase History
| Date | Buyer | Sale Price | Title Company |
|---|---|---|---|
| Nyers Stephanie | -- | Attorney | |
| Nyers Stephanie | $85,000 | -- | |
| Nyers Stephanie | $85,000 | -- | |
| Nyers Stephanie | $170,000 | -- | |
| Farish Timothy J | $118,000 | -- | |
| -- | $47,000 | -- |
Source: Public Records
Mortgage History
| Date | Status | Borrower | Loan Amount |
|---|---|---|---|
| Previous Owner | Nyers Stephanie | $136,000 | |
| Previous Owner | Farish Timothy J | $120,360 |
Source: Public Records
Tax History
| Year | Tax Paid | Tax Assessment Tax Assessment Total Assessment is a certain percentage of the fair market value that is determined by local assessors to be the total taxable value of land and additions on the property. | Land | Improvement |
|---|---|---|---|---|
| 2025 | $6,547 | $145,890 | $42,320 | $103,570 |
| 2024 | $6,547 | $145,890 | $42,320 | $103,570 |
| 2023 | $6,464 | $145,880 | $42,315 | $103,565 |
| 2022 | $5,214 | $100,530 | $37,980 | $62,550 |
| 2021 | $5,223 | $100,530 | $37,980 | $62,550 |
| 2020 | $5,230 | $100,530 | $37,980 | $62,550 |
| 2019 | $4,478 | $73,820 | $37,980 | $35,840 |
| 2018 | $4,408 | $73,820 | $37,980 | $35,840 |
| 2017 | $4,475 | $73,820 | $37,980 | $35,840 |
| 2016 | $4,788 | $72,280 | $19,670 | $52,610 |
| 2015 | $4,346 | $72,280 | $19,670 | $52,610 |
| 2014 | $4,357 | $72,280 | $19,670 | $52,610 |
| 2013 | $1,953 | $65,695 | $17,885 | $47,810 |
Source: Public Records
Map
Nearby Homes
- 1010 Bruck St
- 472 E Whittier St
- 432 E Kossuth St
- 243 E Whittier St Unit 245
- 497 E Kossuth St
- 253 E Kossuth St Unit 253-H
- 320 E Columbus St
- 395 E Deshler Ave
- 517 Forest St
- 1106-1116 Parsons Ave
- 530 Stewart Ave
- 510 Cline St
- 514 Cline St
- 512 Cline St
- 516 Cline St
- 550 Stewart Ave
- 707 Sycamore Place Unit 707
- 135 E Whittier St
- 136 E Whittier St
- 259 Thurman Ave
- 387 E Whittier St
- 377 E Whittier St
- 391 E Whittier St
- 375 E Whittier St
- 395 E Whittier St
- 371 E Whittier St
- 376 Reinhard Ave
- 380 Reinhard Ave
- 372 Reinhard Ave
- 390 E Whittier St
- 380 E Whittier St
- 384 Reinhard Ave
- 368 Reinhard Ave
- 401 E Whittier St
- 396 E Whittier St
- 382 E Whittier St
- 361 E Whittier St
- 398 E Whittier St
- 388 Reinhard Ave
- 364 Reinhard Ave
Your Personal Tour Guide
Ask me questions while you tour the home.