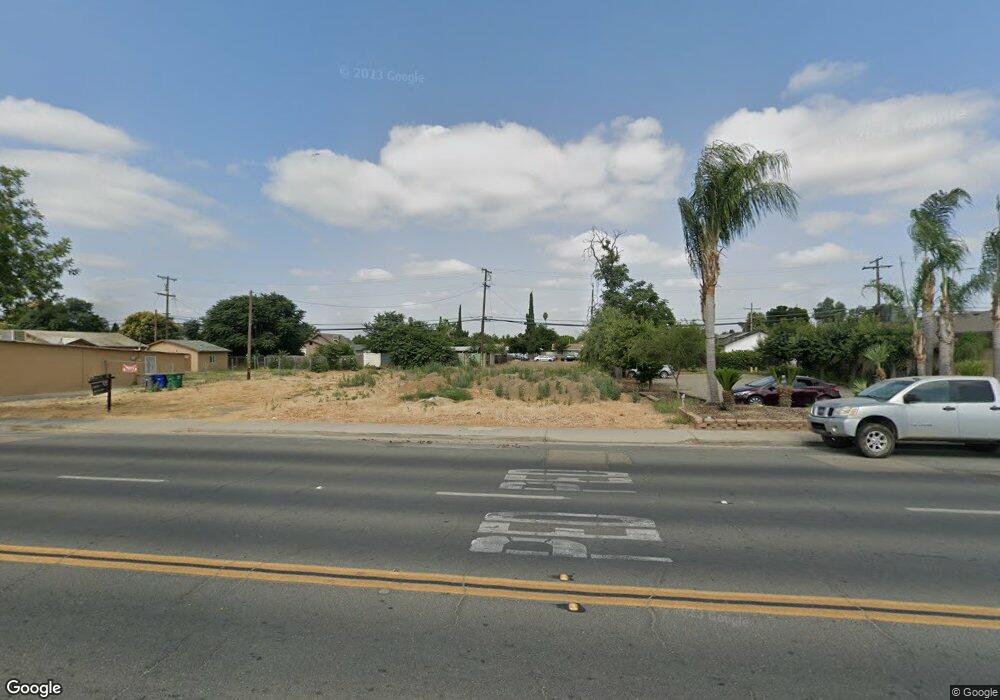
383 N Farmersville Blvd Farmersville, CA 93223
Estimated Value: $73,832
--
Bed
--
Bath
451
Sq Ft
$164/Sq Ft
Est. Value
About This Home
This home is located at 383 N Farmersville Blvd, Farmersville, CA 93223 and is currently estimated at $73,832, approximately $163 per square foot. 383 N Farmersville Blvd is a home located in Tulare County with nearby schools including J.E. Hester Elementary School, George L. Snowden Elementary School, and Freedom Elementary School.
Ownership History
Date
Name
Owned For
Owner Type
Purchase Details
Closed on
Dec 13, 2022
Sold by
Godinez Joaquin
Bought by
Anh Investment Group Llc
Current Estimated Value
Purchase Details
Closed on
May 18, 2022
Sold by
Trujillo Espindola Jorge
Bought by
Godinez Joaquin
Purchase Details
Closed on
May 16, 2022
Sold by
Elena Rodriguez Maria
Bought by
Rodriguez Eduardo
Purchase Details
Closed on
May 6, 2022
Sold by
Trinidad Degodinez Ma
Bought by
Godinez Joaquin
Purchase Details
Closed on
Feb 20, 2019
Sold by
Rodriguez Eduardo
Bought by
Espindola Jorge Trujillo
Purchase Details
Closed on
Dec 31, 2006
Sold by
Castanon Antonio
Bought by
Rodriguez Eduardo
Purchase Details
Closed on
Dec 14, 2005
Sold by
Castanon Pablo
Bought by
Castanon Antonio
Purchase Details
Closed on
Nov 21, 2005
Sold by
Reyes Dora
Bought by
Castanon Pablo
Create a Home Valuation Report for This Property
The Home Valuation Report is an in-depth analysis detailing your home's value as well as a comparison with similar homes in the area
Home Values in the Area
Average Home Value in this Area
Purchase History
| Date | Buyer | Sale Price | Title Company |
|---|---|---|---|
| Anh Investment Group Llc | $66,000 | First American Title | |
| Godinez Joaquin | $63,000 | First American Title | |
| Rodriguez Eduardo | -- | First American Title | |
| Godinez Joaquin | -- | First American Title | |
| Espindola Jorge Trujillo | -- | None Available | |
| Rodriguez Eduardo | -- | None Available | |
| Castanon Antonio | -- | -- | |
| Castanon Pablo | $62,000 | Chicago Title Company |
Source: Public Records
Tax History Compared to Growth
Tax History
| Year | Tax Paid | Tax Assessment Tax Assessment Total Assessment is a certain percentage of the fair market value that is determined by local assessors to be the total taxable value of land and additions on the property. | Land | Improvement |
|---|---|---|---|---|
| 2025 | $758 | $68,666 | $68,666 | -- |
| 2024 | $758 | $67,320 | $67,320 | -- |
| 2023 | $750 | $66,000 | $66,000 | $0 |
| 2022 | $564 | $52,559 | $52,559 | $0 |
| 2021 | $553 | $51,528 | $51,528 | $0 |
| 2020 | $554 | $51,000 | $51,000 | $0 |
| 2019 | $811 | $72,062 | $72,062 | $0 |
| 2018 | $784 | $70,649 | $70,649 | $0 |
| 2017 | $784 | $69,264 | $69,264 | $0 |
| 2016 | $749 | $67,906 | $67,906 | $0 |
| 2015 | $716 | $66,886 | $66,886 | $0 |
| 2014 | $716 | $65,576 | $65,576 | $0 |
Source: Public Records
Map
Nearby Homes
- 438 N Magnolia Ave
- 701 Farmersville Rd
- 209 S Magnolia Ave
- 896 Farmersville Rd
- 327 S Farmersville Blvd
- 0 S Farmersville Blvd Unit 238390
- 680 E Larry St
- 738 E Larry St
- 245 W Oakland St
- 528 S Camelia Ave
- 885 E Ash St
- 903 E Ash St
- 322 E Citrus Dr
- 896 N Mariposa Ave
- 732 N Dwight Ave
- 753 N Brundage Ave
- 1643 Tehama Ave
- 0 Avenue 288
- 0 Avenue 288
- 0 Apn 128-030-056-000 Unit 218742
- 383 N Farmersville Blvd
- 403 N Farmersville Blvd
- 371 N Farmersville Blvd
- 371 Farmersville Rd
- 349 N Farmersville Blvd
- 402 N Linnell Ave
- 374 N Linnell Ave
- 388 N Linnell Ave
- 364 N Farmersville Blvd
- 354 N Linnell Ave
- 447 N Farmersville Blvd
- 327 Farmersville Rd
- 348 N Farmersville Blvd
- 412 Farmersville Rd
- 412 N Farmersville Blvd
- 432 N Farmersville Blvd
- 463 N Farmersville Blvd
- 330 N Farmersville Blvd
- 172 W Elm St
- 318 N Farmersville Blvd