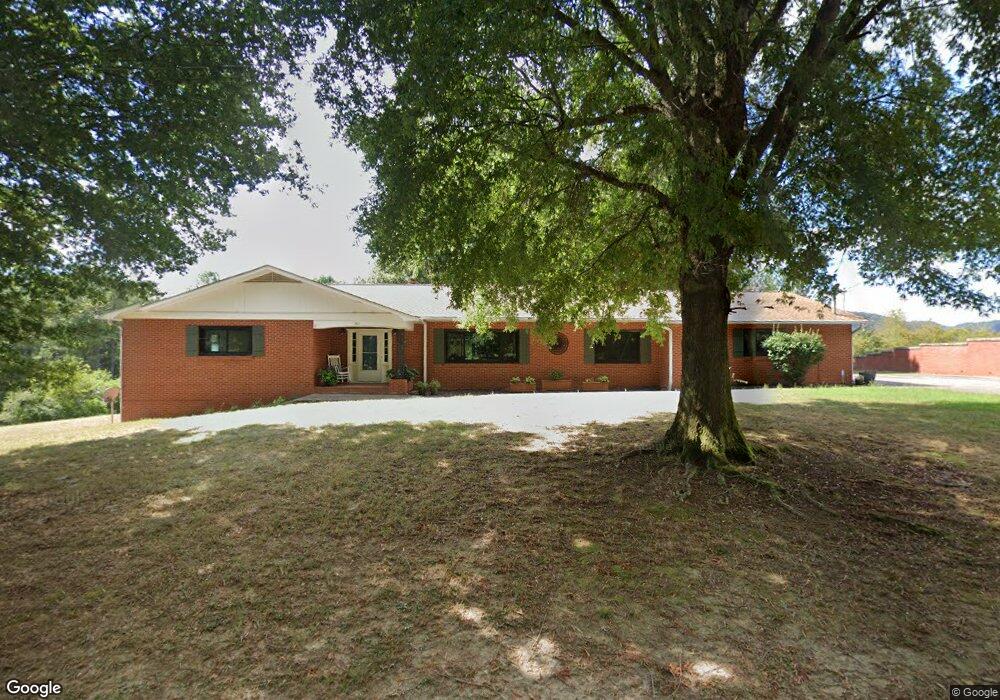
383 N Hillcrest Dr Unit lot 12 Spring City, TN 37381
Estimated Value: $358,000 - $496,266
--
Bed
4
Baths
2,523
Sq Ft
$166/Sq Ft
Est. Value
About This Home
This home is located at 383 N Hillcrest Dr Unit lot 12, Spring City, TN 37381 and is currently estimated at $419,317, approximately $166 per square foot. 383 N Hillcrest Dr Unit lot 12 is a home located in Rhea County with nearby schools including Rhea County High School, King Memorial Seventh Day Adve, and Spring City Christian Academy.
Ownership History
Date
Name
Owned For
Owner Type
Purchase Details
Closed on
Feb 2, 2021
Sold by
Latour Fayelynn and Garner Karen Sue
Bought by
The Adkinson Living Trust
Current Estimated Value
Purchase Details
Closed on
Apr 30, 2020
Sold by
Latour Fayelynn and Gerner Melvin M
Bought by
Latourt Fayelynn and Garner Karen Sue
Purchase Details
Closed on
Jun 4, 2019
Sold by
Garner Melvin M and Garner Patricia A
Bought by
Garner Melvin M and Latour Fayelynn
Purchase Details
Closed on
Dec 18, 2006
Bought by
Garner Melvin M
Purchase Details
Closed on
Sep 30, 2005
Bought by
Garner Melvin M and Garner Patricia A
Purchase Details
Closed on
Nov 9, 1994
Bought by
Maybery Wallace and Maybery Lucille
Purchase Details
Closed on
May 16, 1994
Bought by
Morgan William J and Morgan Jo Ann
Purchase Details
Closed on
Dec 19, 1938
Bought by
Kemmer Robert W and Kemmer Nola
Create a Home Valuation Report for This Property
The Home Valuation Report is an in-depth analysis detailing your home's value as well as a comparison with similar homes in the area
Home Values in the Area
Average Home Value in this Area
Purchase History
| Date | Buyer | Sale Price | Title Company |
|---|---|---|---|
| The Adkinson Living Trust | $256,000 | None Available | |
| Latourt Fayelynn | -- | None Available | |
| Garner Melvin M | -- | None Available | |
| Garner Melvin M | -- | -- | |
| Garner Melvin M | $162,000 | -- | |
| Maybery Wallace | $135,000 | -- | |
| Morgan William J | -- | -- | |
| Kemmer Robert W | -- | -- |
Source: Public Records
Tax History Compared to Growth
Tax History
| Year | Tax Paid | Tax Assessment Tax Assessment Total Assessment is a certain percentage of the fair market value that is determined by local assessors to be the total taxable value of land and additions on the property. | Land | Improvement |
|---|---|---|---|---|
| 2024 | -- | $108,600 | $7,900 | $100,700 |
| 2023 | $2,183 | $57,075 | $4,850 | $52,225 |
| 2022 | $2,155 | $57,075 | $4,850 | $52,225 |
| 2021 | $2,115 | $57,075 | $4,850 | $52,225 |
| 2020 | $1,921 | $57,075 | $4,850 | $52,225 |
| 2019 | $1,921 | $57,075 | $4,850 | $52,225 |
| 2018 | $1,750 | $52,925 | $4,675 | $48,250 |
| 2017 | $1,671 | $52,925 | $4,675 | $48,250 |
| 2016 | $1,671 | $52,925 | $4,675 | $48,250 |
| 2015 | $1,618 | $52,925 | $4,675 | $48,250 |
| 2014 | $1,110 | $52,925 | $4,675 | $48,250 |
| 2013 | -- | $52,925 | $4,675 | $48,250 |
Source: Public Records
Map
Nearby Homes
- 383 N Hillcrest Dr
- Lot 15 N Hillcrest Dr
- 399 N Hillcrest Dr
- 399 N Hillcrest Dr
- 0 N Hillcrest Dr Unit 1318696
- 0 N Hillcrest Dr Unit 20132968
- 15 N Hillcrest Dr
- 0 N Hillcrest Dr Unit 20180244
- 00 N Hillcrest Dr
- Lot 12 N Hillcrest Dr
- Lot 12 N Hillcrest Dr Unit 12
- 0 N Hillcrest Dr
- 319 N Hillcrest Dr
- 342 N Hillcrest Dr
- 872 Hinch St
- 301 N Hillcrest Dr
- 301 N Hillcrest Dr Unit 16
- 464 N Hillcrest Dr
- 464 N Hillcrest Dr Unit 230
- 14.00 Hinch St