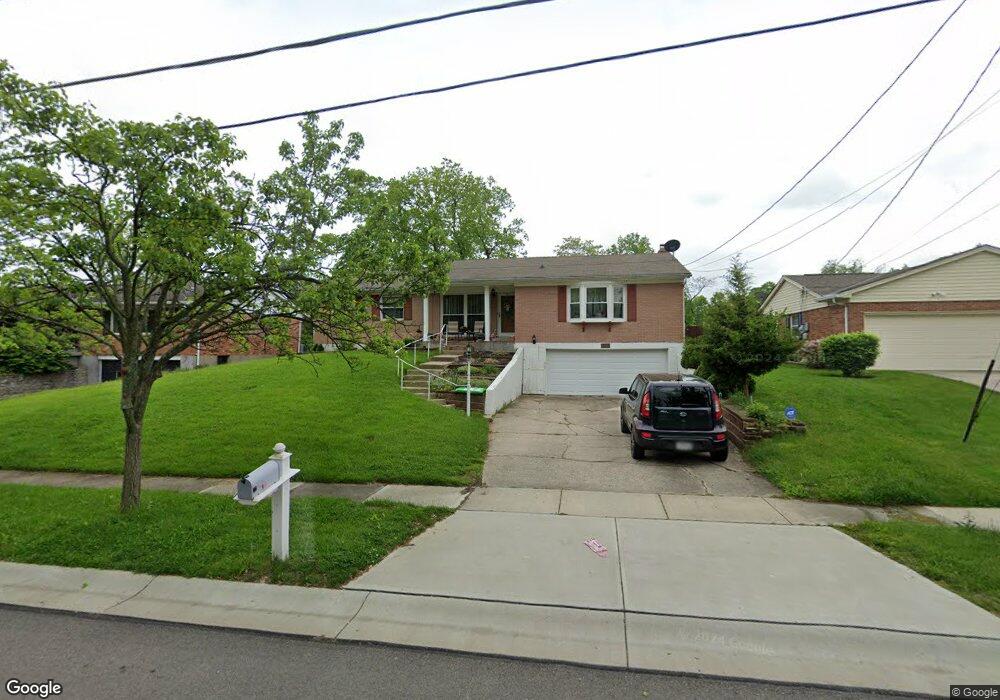
383 Naylor Ct Cincinnati, OH 45246
Estimated Value: $275,000 - $396,000
5
Beds
3
Baths
1,785
Sq Ft
$194/Sq Ft
Est. Value
About This Home
This home is located at 383 Naylor Ct, Cincinnati, OH 45246 and is currently estimated at $346,950, approximately $194 per square foot. 383 Naylor Ct is a home located in Hamilton County with nearby schools including Springdale Elementary School, Princeton Community Middle School, and Princeton High School.
Ownership History
Date
Name
Owned For
Owner Type
Purchase Details
Closed on
May 24, 2004
Sold by
Houchen Bonnie J
Bought by
Hernandez Anselmo
Current Estimated Value
Home Financials for this Owner
Home Financials are based on the most recent Mortgage that was taken out on this home.
Original Mortgage
$145,350
Outstanding Balance
$68,925
Interest Rate
5.99%
Mortgage Type
New Conventional
Estimated Equity
$278,025
Purchase Details
Closed on
Oct 30, 1998
Sold by
Houchen Paul R and Houchen Mary H
Bought by
Houchen Bonnie J
Create a Home Valuation Report for This Property
The Home Valuation Report is an in-depth analysis detailing your home's value as well as a comparison with similar homes in the area
Home Values in the Area
Average Home Value in this Area
Purchase History
| Date | Buyer | Sale Price | Title Company |
|---|---|---|---|
| Hernandez Anselmo | $153,000 | Chicago Title Insurance Comp | |
| Houchen Bonnie J | -- | -- |
Source: Public Records
Mortgage History
| Date | Status | Borrower | Loan Amount |
|---|---|---|---|
| Open | Hernandez Anselmo | $145,350 |
Source: Public Records
Tax History
| Year | Tax Paid | Tax Assessment Tax Assessment Total Assessment is a certain percentage of the fair market value that is determined by local assessors to be the total taxable value of land and additions on the property. | Land | Improvement |
|---|---|---|---|---|
| 2025 | $5,087 | $101,277 | $13,885 | $87,392 |
| 2023 | $4,384 | $101,277 | $13,885 | $87,392 |
| 2022 | $3,802 | $71,418 | $13,538 | $57,880 |
| 2021 | $3,702 | $71,418 | $13,538 | $57,880 |
| 2020 | $3,742 | $71,418 | $13,538 | $57,880 |
| 2019 | $3,464 | $61,040 | $11,571 | $49,469 |
| 2018 | $4,289 | $61,040 | $11,571 | $49,469 |
| 2017 | $3,064 | $61,040 | $11,571 | $49,469 |
| 2016 | $2,960 | $58,503 | $10,878 | $47,625 |
| 2015 | $2,986 | $58,503 | $10,878 | $47,625 |
| 2014 | $2,996 | $58,503 | $10,878 | $47,625 |
| 2013 | $3,117 | $62,237 | $11,571 | $50,666 |
Source: Public Records
Map
Nearby Homes
- 440 W Sharon Rd
- 483 Vista Glen Dr
- 163 Washington Ave
- 287 Bedford Glen Ln Unit 27
- 256 Centerbury Ct Unit 67
- 237 Eastwick Dr
- 11570 Rose Ln
- 602 Brightview Place
- 602 Brightview Place Unit 34
- 162 Sheffield Rd
- 683 Danbury Rd
- 958 Summit Ave
- 564 Waycross Rd
- 156 Sheffield Rd
- 820 van Nes Dr
- 564 Cloverdale Ave
- 749 Converse Dr
- 778 Danbury Rd
- 604 Smiley Ave
- 45 S Lake Ave
Your Personal Tour Guide
Ask me questions while you tour the home.