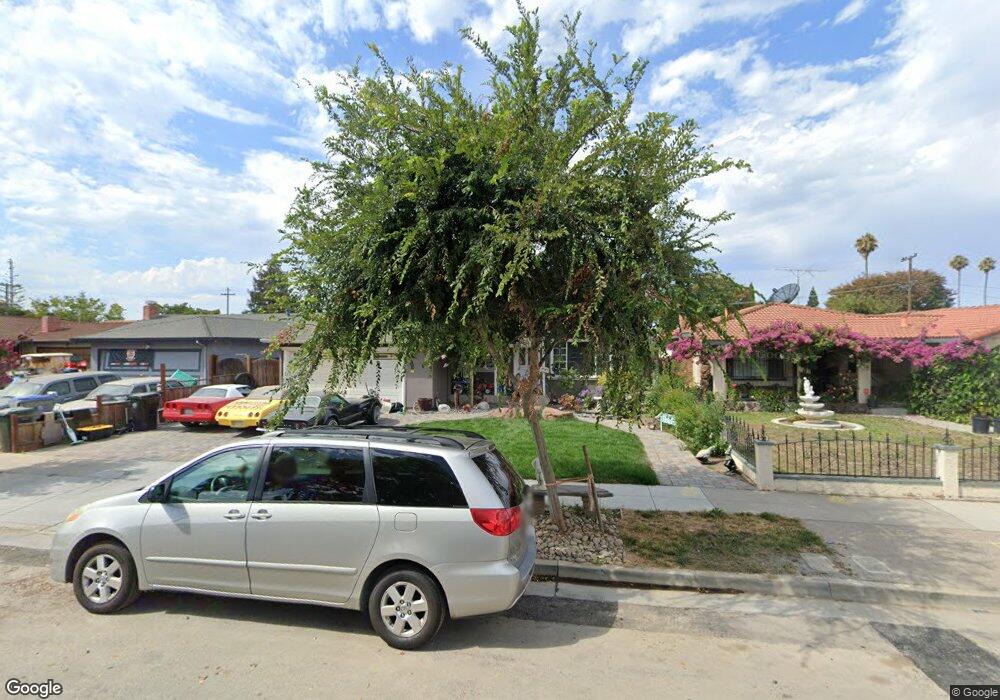
383 Royce Dr San Jose, CA 95133
Commodore NeighborhoodEstimated Value: $1,051,000 - $1,296,000
3
Beds
2
Baths
1,092
Sq Ft
$1,048/Sq Ft
Est. Value
About This Home
This home is located at 383 Royce Dr, San Jose, CA 95133 and is currently estimated at $1,144,917, approximately $1,048 per square foot. 383 Royce Dr is a home located in Santa Clara County with nearby schools including Anne Darling Elementary, Muwekma Ohlone Middle, and San Jose High School.
Ownership History
Date
Name
Owned For
Owner Type
Purchase Details
Closed on
Jun 22, 2005
Sold by
Rodriguez Gail Adelina and Rodriguez Alex
Bought by
Rodriguez Alex and Morimoto Lynnette
Current Estimated Value
Home Financials for this Owner
Home Financials are based on the most recent Mortgage that was taken out on this home.
Original Mortgage
$290,000
Outstanding Balance
$157,294
Interest Rate
6.37%
Mortgage Type
Purchase Money Mortgage
Estimated Equity
$987,623
Purchase Details
Closed on
Jun 16, 2005
Sold by
Rodriguez Gail Adelina
Bought by
Rodriguez Gail Adelina and Rodriguez Alex
Home Financials for this Owner
Home Financials are based on the most recent Mortgage that was taken out on this home.
Original Mortgage
$290,000
Outstanding Balance
$157,294
Interest Rate
6.37%
Mortgage Type
Purchase Money Mortgage
Estimated Equity
$987,623
Create a Home Valuation Report for This Property
The Home Valuation Report is an in-depth analysis detailing your home's value as well as a comparison with similar homes in the area
Home Values in the Area
Average Home Value in this Area
Purchase History
| Date | Buyer | Sale Price | Title Company |
|---|---|---|---|
| Rodriguez Alex | $97,000 | Alliance Title Company | |
| Rodriguez Gail Adelina | -- | -- |
Source: Public Records
Mortgage History
| Date | Status | Borrower | Loan Amount |
|---|---|---|---|
| Open | Rodriguez Alex | $290,000 |
Source: Public Records
Tax History Compared to Growth
Tax History
| Year | Tax Paid | Tax Assessment Tax Assessment Total Assessment is a certain percentage of the fair market value that is determined by local assessors to be the total taxable value of land and additions on the property. | Land | Improvement |
|---|---|---|---|---|
| 2025 | $11,252 | $808,450 | $529,679 | $278,771 |
| 2024 | $11,252 | $792,599 | $519,294 | $273,305 |
| 2023 | $11,016 | $777,059 | $509,112 | $267,947 |
| 2022 | $10,894 | $761,824 | $499,130 | $262,694 |
| 2021 | $10,627 | $746,888 | $489,344 | $257,544 |
| 2020 | $10,311 | $739,231 | $484,327 | $254,904 |
| 2019 | $10,056 | $724,737 | $474,831 | $249,906 |
| 2018 | $9,935 | $710,527 | $465,521 | $245,006 |
| 2017 | $8,616 | $594,000 | $389,100 | $204,900 |
| 2016 | $7,977 | $545,000 | $357,000 | $188,000 |
| 2015 | $7,775 | $525,000 | $344,000 | $181,000 |
| 2014 | $6,688 | $494,000 | $323,700 | $170,300 |
Source: Public Records
Map
Nearby Homes
- 1508 Marburg Way
- 264 N 34th St
- 1565 E Saint James St
- 1715 Calle de Plata
- 1816 Luby Dr Unit 46
- 1622 Perry Ct
- 125 Magellan Ave
- 295 Esmeralda Ct
- 1227 Coyote Creek Ct
- 482 Coyote Creek Cir
- 432 Coyote Creek Cir
- 1246 Coyote Creek Place
- 176 N 24th St
- 1826 Perrone Cir
- 67 Silcreek Dr
- 1945 Galileo Ln
- 412 N 21st St
- 1672 E San Fernando St
- 91 Castlebridge Dr
- 1988 Prince George Dr