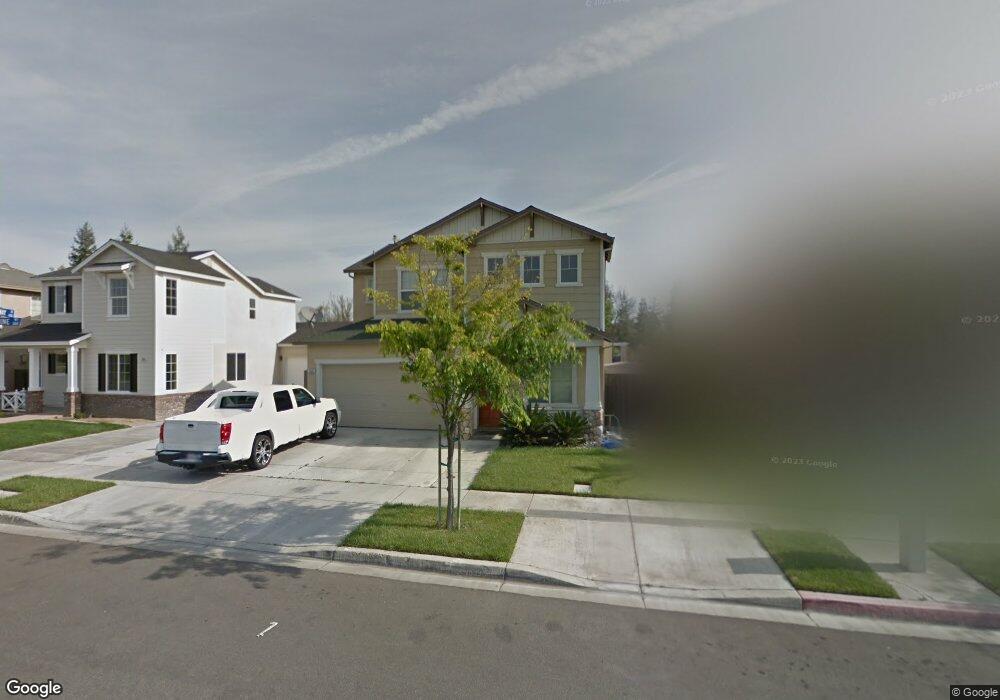
383 Sunshine Way Turlock, CA 95382
Estimated Value: $522,000 - $654,000
4
Beds
3
Baths
2,120
Sq Ft
$287/Sq Ft
Est. Value
About This Home
This home is located at 383 Sunshine Way, Turlock, CA 95382 and is currently estimated at $608,663, approximately $287 per square foot. 383 Sunshine Way is a home located in Stanislaus County with nearby schools including Sandra Tovar Medeiros Elementary School, Turlock Junior High School, and Marvin A. Dutcher Middle School.
Ownership History
Date
Name
Owned For
Owner Type
Purchase Details
Closed on
Nov 25, 2024
Sold by
Shamoon Ashour Y and Shamoon Ashour
Bought by
Ashour Shamoon And Zina Shamoon Revocable Liv and Shamoon
Current Estimated Value
Purchase Details
Closed on
Jan 19, 2016
Sold by
Shamoon Ashour and Shamoon Zin
Bought by
Shamoon Ashour Y and Shamoon Zina
Home Financials for this Owner
Home Financials are based on the most recent Mortgage that was taken out on this home.
Original Mortgage
$280,830
Interest Rate
4.25%
Mortgage Type
FHA
Purchase Details
Closed on
Dec 24, 2003
Sold by
Valley Cottages Llc
Bought by
Shamoon Ashour and Shamoon Zina
Home Financials for this Owner
Home Financials are based on the most recent Mortgage that was taken out on this home.
Original Mortgage
$234,620
Interest Rate
5.81%
Mortgage Type
Purchase Money Mortgage
Create a Home Valuation Report for This Property
The Home Valuation Report is an in-depth analysis detailing your home's value as well as a comparison with similar homes in the area
Home Values in the Area
Average Home Value in this Area
Purchase History
| Date | Buyer | Sale Price | Title Company |
|---|---|---|---|
| Ashour Shamoon And Zina Shamoon Revocable Liv | -- | None Listed On Document | |
| Shamoon Ashour Y | -- | Stewart Title Of Ca Inc | |
| Shamoon Ashour | $294,000 | Alliance Title Company |
Source: Public Records
Mortgage History
| Date | Status | Borrower | Loan Amount |
|---|---|---|---|
| Previous Owner | Shamoon Ashour Y | $280,830 | |
| Previous Owner | Shamoon Ashour | $234,620 | |
| Closed | Shamoon Ashour | $58,655 |
Source: Public Records
Tax History Compared to Growth
Tax History
| Year | Tax Paid | Tax Assessment Tax Assessment Total Assessment is a certain percentage of the fair market value that is determined by local assessors to be the total taxable value of land and additions on the property. | Land | Improvement |
|---|---|---|---|---|
| 2025 | $4,802 | $448,044 | $99,515 | $348,529 |
| 2024 | $4,789 | $439,260 | $97,564 | $341,696 |
| 2023 | $4,905 | $430,648 | $95,651 | $334,997 |
| 2022 | $4,616 | $401,705 | $93,776 | $307,929 |
| 2021 | $4,515 | $393,830 | $91,938 | $301,892 |
| 2020 | $4,479 | $389,793 | $90,996 | $298,797 |
| 2019 | $4,393 | $382,151 | $89,212 | $292,939 |
| 2018 | $4,387 | $374,659 | $87,463 | $287,196 |
| 2017 | $4,270 | $367,314 | $85,749 | $281,565 |
| 2016 | $3,998 | $360,113 | $84,068 | $276,045 |
| 2015 | $3,698 | $330,500 | $67,200 | $263,300 |
| 2014 | $3,339 | $295,000 | $60,000 | $235,000 |
Source: Public Records
Map
Nearby Homes
- 4188 Fall Creek Ct
- 1901 Geer Rd
- 217 Castile Ln
- 624 Summerton Ln
- 4004 St George Place
- 715 W Taylor Rd
- 995 W Springer Dr
- 342 Sunnyhill Dr
- 4184 Horizon Ct
- 1062 Ashford Dr
- 1173 Woodland Dr
- 4591 Sandpiper Cir
- 0 N Berkeley Unit 225014691
- 5333 Geer Rd
- 1360 Shady Ln Unit 1022
- 1360 Shady Ln Unit 522
- 1360 Shady Ln Unit 923
- 924 Dancer Way
- 3884 Paula Ct
- 3010 Andre Ln
- 393 Sunshine Way
- 373 Sunshine Way
- 403 Sunshine Way
- 363 Sunshine Way
- 4350 Abbey Ct
- 4340 Abbey Ct
- 413 Sunshine Way
- 353 Sunshine Way
- 4199 Fall Creek Ct
- 4209 Fall Creek Ct
- 4221 Jasmine Ct
- 4360 Abbey Ct
- 4195 Pathway Ln
- 378 Sunshine Way
- 343 Sunshine Way
- 4231 Jasmine Ct
- 408 Sunshine Way
- 4320 Abbey Ct
- 368 Sunshine Way
- 358 Sunshine Way