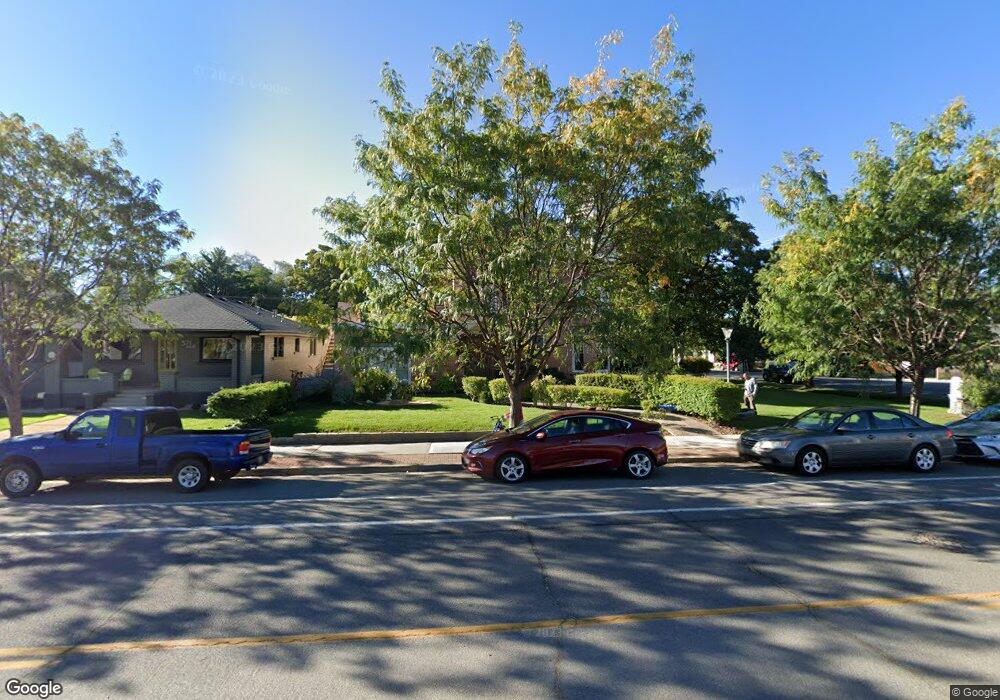
383 W 100 S Provo, UT 84601
Franklin NeighborhoodEstimated Value: $1,450,244
Studio
11
Baths
6,016
Sq Ft
$241/Sq Ft
Est. Value
About This Home
This home is located at 383 W 100 S, Provo, UT 84601 and is currently priced at $1,450,244, approximately $241 per square foot. 383 W 100 S is a home located in Utah County with nearby schools including Franklin Elementary School, Dixon Middle School, and Provo High School.
Ownership History
Date
Name
Owned For
Owner Type
Purchase Details
Closed on
Jun 14, 2023
Sold by
Hines B & B Llc
Bought by
Sorensen Riley and Sorensen Kaylee
Current Estimated Value
Purchase Details
Closed on
Jul 8, 2015
Sold by
Row By Rowe Llc
Bought by
Hines B & B Llc
Home Financials for this Owner
Home Financials are based on the most recent Mortgage that was taken out on this home.
Original Mortgage
$500,000
Interest Rate
4.01%
Mortgage Type
Commercial
Purchase Details
Closed on
Sep 5, 2007
Sold by
Campbell Debra Kay
Bought by
Bennett Clara C
Purchase Details
Closed on
Dec 20, 2002
Sold by
Henderson Gene R and Henderson Sandra
Bought by
Rowe By Rowe Llc
Home Financials for this Owner
Home Financials are based on the most recent Mortgage that was taken out on this home.
Original Mortgage
$712,000
Interest Rate
6.03%
Mortgage Type
Commercial
Purchase Details
Closed on
Nov 30, 2000
Sold by
Bylund Brent
Bought by
Bylund Brent T and Bylund Julie M
Create a Home Valuation Report for This Property
The Home Valuation Report is an in-depth analysis detailing your home's value as well as a comparison with similar homes in the area
Home Values in the Area
Average Home Value in this Area
Purchase History
| Date | Buyer | Sale Price | Title Company |
|---|---|---|---|
| Sorensen Riley | -- | Pioneer Title | |
| Hines B & B Llc | -- | Inwest Title | |
| Bennett Clara C | -- | None Available | |
| Rowe By Rowe Llc | -- | Mountain West Title Co | |
| Bylund Brent T | -- | Title West Title Co |
Source: Public Records
Mortgage History
| Date | Status | Borrower | Loan Amount |
|---|---|---|---|
| Previous Owner | Hines B & B Llc | $500,000 | |
| Previous Owner | Rowe By Rowe Llc | $712,000 |
Source: Public Records
Tax History
| Year | Tax Paid | Tax Assessment Tax Assessment Total Assessment is a certain percentage of the fair market value that is determined by local assessors to be the total taxable value of land and additions on the property. | Land | Improvement |
|---|---|---|---|---|
| 2025 | $12,922 | $1,194,900 | $340,500 | $854,400 |
| 2024 | $12,922 | $1,272,000 | $0 | $0 |
| 2023 | $12,859 | $1,247,800 | $0 | $0 |
| 2022 | $10,276 | $1,005,500 | $317,300 | $688,200 |
| 2021 | $6,798 | $638,100 | $215,100 | $423,000 |
| 2020 | $9,065 | $797,600 | $225,200 | $572,400 |
| 2019 | $8,497 | $777,500 | $204,400 | $573,100 |
| 2018 | $7,891 | $732,300 | $194,700 | $537,600 |
| 2017 | $6,830 | $633,300 | $0 | $0 |
| 2016 | $7,227 | $624,600 | $0 | $0 |
| 2015 | $7,054 | $616,200 | $0 | $0 |
| 2014 | $6,679 | $608,200 | $0 | $0 |
Source: Public Records
Map
Nearby Homes
Your Personal Tour Guide
Ask me questions while you tour the home.