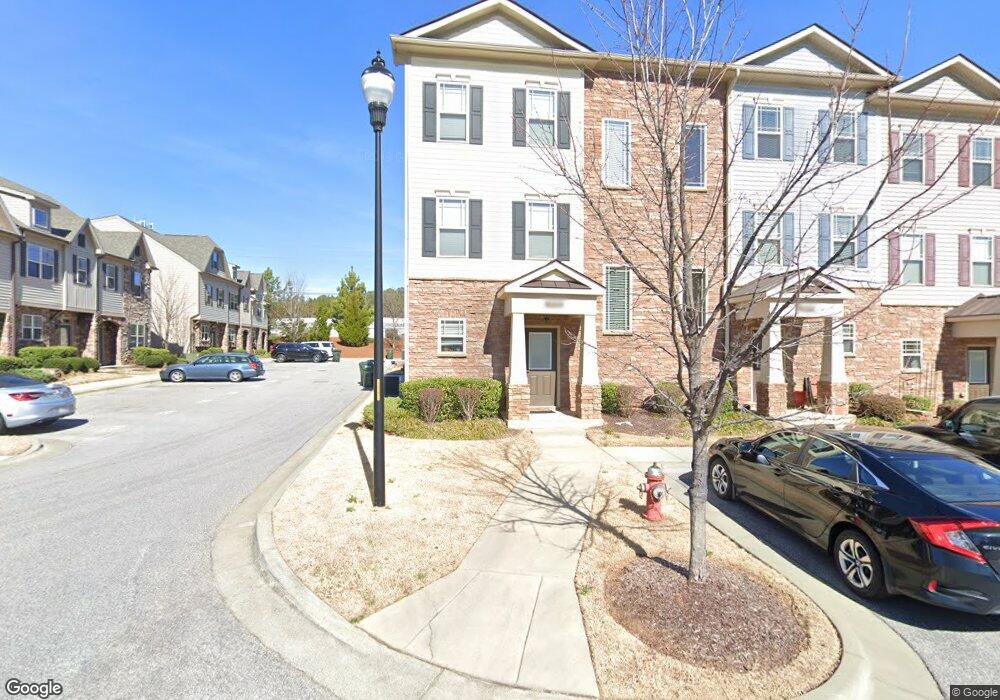
3830 Amelia Park Dr Raleigh, NC 27606
South Raleigh NeighborhoodEstimated Value: $350,956 - $384,000
3
Beds
3
Baths
1,600
Sq Ft
$226/Sq Ft
Est. Value
About This Home
This home is located at 3830 Amelia Park Dr, Raleigh, NC 27606 and is currently estimated at $361,489, approximately $225 per square foot. 3830 Amelia Park Dr is a home located in Wake County with nearby schools including Swift Creek Elementary School, Dillard Drive Magnet Middle School, and Adventist Christian Academy of Raleigh.
Ownership History
Date
Name
Owned For
Owner Type
Purchase Details
Closed on
Sep 10, 2025
Sold by
Nguyen Brandon and Nguyen Evie
Bought by
Nguyen Nam Thanh and Nguyen Hoang Dam
Current Estimated Value
Purchase Details
Closed on
Aug 18, 2021
Sold by
Lobo Alex Fernando Duarte and Taiba Sara M
Bought by
Nguyen Brandon and Nguyen Evie
Home Financials for this Owner
Home Financials are based on the most recent Mortgage that was taken out on this home.
Original Mortgage
$324,950
Interest Rate
2.9%
Mortgage Type
New Conventional
Purchase Details
Closed on
Mar 22, 2011
Sold by
Westmoreland Corporation
Bought by
Lobo Alex Fernando Duarte
Home Financials for this Owner
Home Financials are based on the most recent Mortgage that was taken out on this home.
Original Mortgage
$154,900
Interest Rate
4.99%
Mortgage Type
New Conventional
Create a Home Valuation Report for This Property
The Home Valuation Report is an in-depth analysis detailing your home's value as well as a comparison with similar homes in the area
Home Values in the Area
Average Home Value in this Area
Purchase History
| Date | Buyer | Sale Price | Title Company |
|---|---|---|---|
| Nguyen Nam Thanh | $375,000 | Secure Title | |
| Nguyen Brandon | $335,000 | None Available | |
| Lobo Alex Fernando Duarte | $157,500 | None Available |
Source: Public Records
Mortgage History
| Date | Status | Borrower | Loan Amount |
|---|---|---|---|
| Previous Owner | Nguyen Brandon | $324,950 | |
| Previous Owner | Lobo Alex Fernando Duarte | $154,900 |
Source: Public Records
Tax History Compared to Growth
Tax History
| Year | Tax Paid | Tax Assessment Tax Assessment Total Assessment is a certain percentage of the fair market value that is determined by local assessors to be the total taxable value of land and additions on the property. | Land | Improvement |
|---|---|---|---|---|
| 2025 | $2,942 | $335,026 | $90,000 | $245,026 |
| 2024 | $2,930 | $335,026 | $90,000 | $245,026 |
| 2023 | $2,556 | $232,688 | $40,000 | $192,688 |
| 2022 | $2,376 | $232,688 | $40,000 | $192,688 |
| 2021 | $2,284 | $232,688 | $40,000 | $192,688 |
| 2020 | $2,243 | $232,688 | $40,000 | $192,688 |
| 2019 | $2,081 | $177,874 | $34,000 | $143,874 |
| 2018 | $1,963 | $177,874 | $34,000 | $143,874 |
| 2017 | $1,870 | $177,874 | $34,000 | $143,874 |
| 2016 | $1,832 | $177,874 | $34,000 | $143,874 |
| 2015 | $1,802 | $172,046 | $32,000 | $140,046 |
| 2014 | $1,709 | $172,046 | $32,000 | $140,046 |
Source: Public Records
Map
Nearby Homes
- 3977 Amelia Park Dr
- 4017 Tryon Rd
- 3770 Pardue Woods Place Unit 201
- 1929 Fieldhouse Ave
- 2021 Wolftech Ln Unit 102
- 3020 Centennial Woods Dr Unit 101
- 1911 Wolftech Ln Unit 302
- 5229 Moonview Ct
- 4424 Sugarbend Way
- 4510 Sugarbend Way
- 4536 Sugarbend Way
- 5407 Crescentview Pkwy
- 3008 Isabella Dr
- 3223 Tryon Rd
- 5569 Sea Daisy Dr
- 2108 Leadenhall Way
- 3122 Tanager St
- 1901 Trailwood Heights Ln Unit 304
- 5333 Olive Rd
- 2920 Barrymore St Unit 106
- 3828 Amelia Park Dr
- 3826 Amelia Park Dr
- 3831 Glenhaven Rd
- 3831 Glenhaven Rd
- 3824 Amelia Park Dr
- 3829 Glenhaven Rd
- 3827 Glenhaven Rd
- 2828 Carter Finley Place
- 2824 Carter Finley Place
- 3829 Glenhaven Rd
- 3822 Amelia Park Dr
- 2832 Carter Finley Place
- 2820 Carter Finley Place
- 2816 Carter Finley Place
- 3825 Glenhaven Rd
- 3820 Amelia Park Dr
- 3823 Glenhaven Rd
- 3821 Glenhaven Dr
- 2804 Carter Finley Place
- 3821 Glenhaven Rd