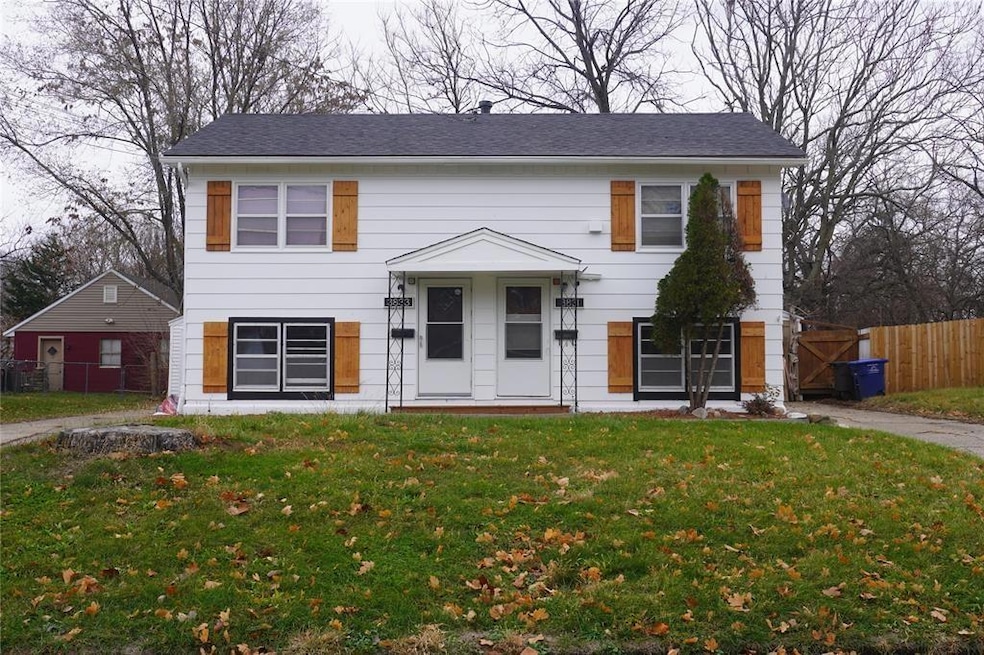


3831 40th St Des Moines, IA 50310
Lower Beaver NeighborhoodEstimated payment $1,872/month
Highlights
- 2 Kitchens
- Laundry Room
- Forced Air Heating and Cooling System
- No HOA
About This Home
Duplex in great Beaverdale neighborhood with 2bed 1 bath per side. Rents total $2,200. Electric and gas tenant paid. Water Landlord. Updated roof. Washer and dryer in each unit.
Property Details
Home Type
- Multi-Family
Est. Annual Taxes
- $4,174
Year Built
- Built in 1963
Lot Details
- 8,640 Sq Ft Lot
- Lot Dimensions are 64x135
Home Design
- 884 Sq Ft Home
- Duplex
- Block Foundation
- Asphalt Shingled Roof
- Metal Siding
Parking
- 1 Car Detached Garage
- Driveway
Additional Features
- 2 Kitchens
- 2 Full Bathrooms
- Laundry Room
- Forced Air Heating and Cooling System
- Finished Basement
Listing and Financial Details
- Assessor Parcel Number 12676-001-000
Community Details
Overview
- No Home Owners Association
- 2 Units
Building Details
- Gross Income $2,200
Map
Home Values in the Area
Average Home Value in this Area
Tax History
| Year | Tax Paid | Tax Assessment Tax Assessment Total Assessment is a certain percentage of the fair market value that is determined by local assessors to be the total taxable value of land and additions on the property. | Land | Improvement |
|---|---|---|---|---|
| 2025 | $3,956 | $221,800 | $52,400 | $169,400 |
| 2024 | $3,956 | $201,100 | $46,700 | $154,400 |
| 2023 | $3,754 | $201,100 | $46,700 | $154,400 |
| 2022 | $3,726 | $159,300 | $39,000 | $120,300 |
| 2021 | $3,768 | $159,300 | $39,000 | $120,300 |
| 2020 | $3,914 | $151,000 | $37,200 | $113,800 |
| 2019 | $3,654 | $151,000 | $37,200 | $113,800 |
| 2018 | $3,618 | $136,000 | $32,900 | $103,100 |
| 2017 | $3,254 | $136,000 | $32,900 | $103,100 |
| 2016 | $3,170 | $120,300 | $28,600 | $91,700 |
| 2015 | $3,170 | $120,300 | $28,600 | $91,700 |
| 2014 | $2,972 | $116,100 | $27,100 | $89,000 |
Property History
| Date | Event | Price | List to Sale | Price per Sq Ft |
|---|---|---|---|---|
| 11/26/2025 11/26/25 | For Sale | $289,900 | -- | $328 / Sq Ft |
Purchase History
| Date | Type | Sale Price | Title Company |
|---|---|---|---|
| Warranty Deed | $230,000 | None Listed On Document | |
| Contract Of Sale | $109,000 | -- |
Mortgage History
| Date | Status | Loan Amount | Loan Type |
|---|---|---|---|
| Open | $174,701 | New Conventional | |
| Previous Owner | $109,000 | Seller Take Back |
Source: Des Moines Area Association of REALTORS®
MLS Number: 731016
APN: 100-12676001000
Disclaimer: Certain information contained herein is derived from information provided by parties other than Homes.com. All information provided is deemed reliable, but is not guaranteed to be accurate and should be independently verified.
![]() IDX information is provided exclusively for personal, non-commercial use, and may not be used for any purpose other than to identify prospective properties consumers may be interested in purchasing. Information is deemed reliable but not guaranteed.
IDX information is provided exclusively for personal, non-commercial use, and may not be used for any purpose other than to identify prospective properties consumers may be interested in purchasing. Information is deemed reliable but not guaranteed.
- 4008 Douglas Ave
- 4020 Douglas Ave
- 3905 Clinton Ave
- 4004 Clinton Ave
- 3833 38th St
- 4015 39th Place
- 3945 38th St
- 4037 Amick Ave
- 4001 42nd St
- 3616 37th St
- 3616 Madison Ave
- 3711 37th St
- 4046 39th Place
- 3846 Lower Beaver Rd
- 4415 Amick Ave
- 3838 Valdez Dr
- 4038 Beaver Ave
- 3605 Davisson Rd
- 4425 Amick Ave
- 3515 Aurora Ave
- 3828 40th St
- 4001 36th Place
- 4532 Douglas Ave
- 4633 Euclid Ave
- 3120 Douglas Ave
- 4530 Lower Beaver Rd
- 2829 Douglas Ave
- 4926 Madison Ave
- 3600 Urbandale Ave Unit 3600 Urbandale Ave
- 2537 Lynner Dr
- 2531 Lynner Dr
- 5000 Twana Dr Unit 1
- 3330 52nd St
- 2300 Beaver Ave
- 2614 Adams Ave
- 2411 Welbeck Rd
- 3710 56th St
- 5413 Aurora Ave
- 2731 Bennett Ave
- 2418 Boston Ave
