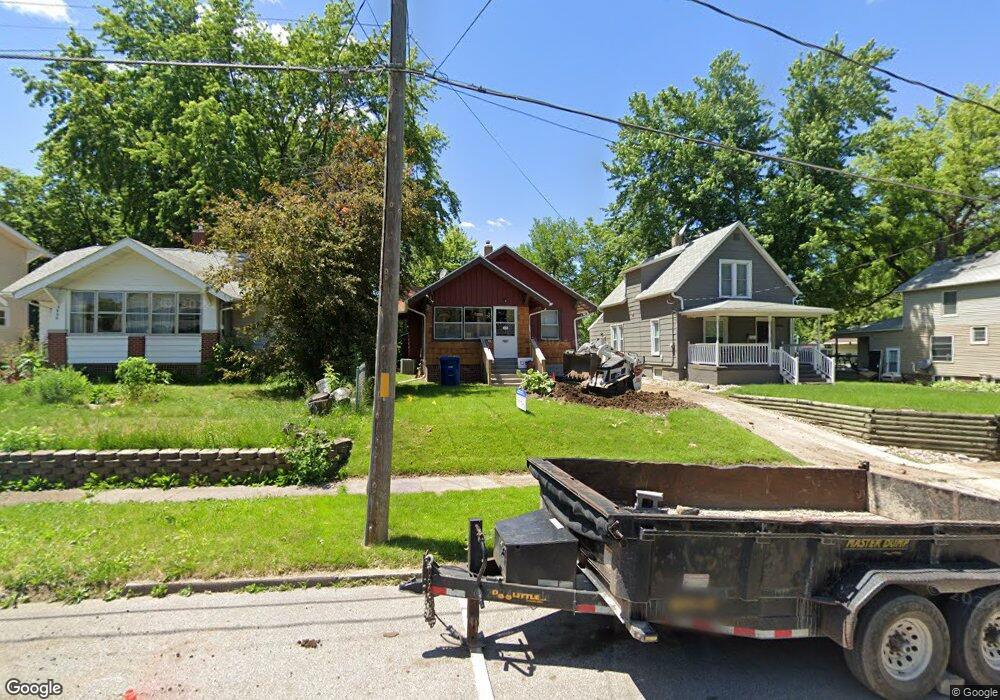
3832 7th St Des Moines, IA 50313
Oak Park NeighborhoodEstimated Value: $119,000 - $143,000
2
Beds
1
Bath
772
Sq Ft
$173/Sq Ft
Est. Value
About This Home
This home is located at 3832 7th St, Des Moines, IA 50313 and is currently estimated at $133,365, approximately $172 per square foot. 3832 7th St is a home located in Polk County with nearby schools including Oak Park Elementary School, Harding Middle School, and North High School.
Ownership History
Date
Name
Owned For
Owner Type
Purchase Details
Closed on
Aug 27, 2021
Sold by
Pohl Samantha C
Bought by
Mick Pohl Sue L
Current Estimated Value
Purchase Details
Closed on
May 20, 2019
Sold by
Mick Donald G and Mick Donald Glenn
Bought by
Mick Donald G and Pohl Samantha C
Purchase Details
Closed on
Feb 17, 1998
Sold by
Pohl Sue L and Pohl Jerry S
Bought by
Mick Donald G
Home Financials for this Owner
Home Financials are based on the most recent Mortgage that was taken out on this home.
Original Mortgage
$37,694
Interest Rate
6.95%
Mortgage Type
FHA
Purchase Details
Closed on
Mar 12, 1997
Sold by
Mick Bobby Don
Bought by
Mick Bobby Don and Pohl Sue L
Create a Home Valuation Report for This Property
The Home Valuation Report is an in-depth analysis detailing your home's value as well as a comparison with similar homes in the area
Home Values in the Area
Average Home Value in this Area
Purchase History
| Date | Buyer | Sale Price | Title Company |
|---|---|---|---|
| Mick Pohl Sue L | -- | None Available | |
| Mick Donald G | -- | None Available | |
| Mick Donald G | -- | -- | |
| Mick Bobby Don | -- | -- |
Source: Public Records
Mortgage History
| Date | Status | Borrower | Loan Amount |
|---|---|---|---|
| Previous Owner | Mick Donald G | $37,694 |
Source: Public Records
Tax History
| Year | Tax Paid | Tax Assessment Tax Assessment Total Assessment is a certain percentage of the fair market value that is determined by local assessors to be the total taxable value of land and additions on the property. | Land | Improvement |
|---|---|---|---|---|
| 2025 | $1,622 | $128,900 | $17,400 | $111,500 |
| 2024 | $1,622 | $107,900 | $15,100 | $92,800 |
| 2023 | $1,558 | $107,900 | $15,100 | $92,800 |
| 2022 | $1,542 | $87,300 | $12,700 | $74,600 |
| 2021 | $1,722 | $87,300 | $12,700 | $74,600 |
| 2020 | $1,784 | $77,600 | $11,400 | $66,200 |
| 2019 | $1,698 | $77,600 | $11,400 | $66,200 |
| 2018 | $1,676 | $71,700 | $10,400 | $61,300 |
| 2017 | $1,516 | $71,700 | $10,400 | $61,300 |
| 2016 | $1,472 | $64,600 | $9,300 | $55,300 |
| 2015 | $1,472 | $64,600 | $9,300 | $55,300 |
| 2014 | $1,402 | $63,700 | $9,100 | $54,600 |
Source: Public Records
Map
Nearby Homes
Your Personal Tour Guide
Ask me questions while you tour the home.