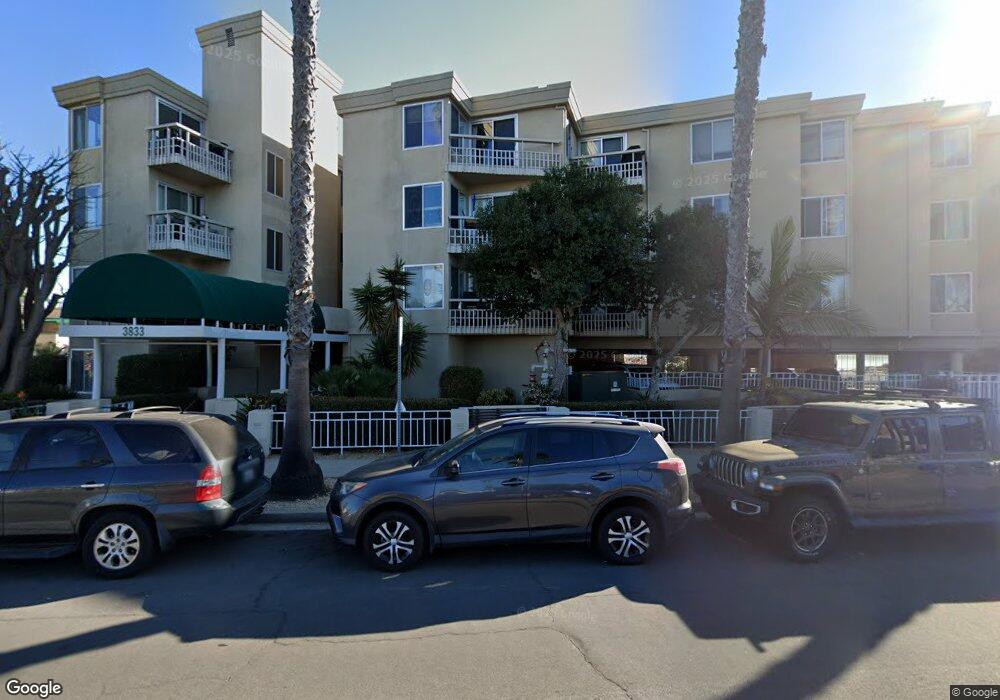
3833 Lamont St Unit 4F San Diego, CA 92109
Pacific Beach NeighborhoodEstimated Value: $607,482 - $641,000
1
Bed
1
Bath
589
Sq Ft
$1,058/Sq Ft
Est. Value
About This Home
This home is located at 3833 Lamont St Unit 4F, San Diego, CA 92109 and is currently estimated at $623,121, approximately $1,057 per square foot. 3833 Lamont St Unit 4F is a home located in San Diego County with nearby schools including Crown Point Junior Music Academy, Pacific Beach Middle, and Mission Bay High School.
Ownership History
Date
Name
Owned For
Owner Type
Purchase Details
Closed on
Oct 22, 1999
Sold by
Manfredi Robert Revocable Trust &
Bought by
Manfredi Family Ltd Partnership
Current Estimated Value
Purchase Details
Closed on
Aug 19, 1997
Sold by
Smith Joel H
Bought by
Manfredi Robert
Home Financials for this Owner
Home Financials are based on the most recent Mortgage that was taken out on this home.
Original Mortgage
$105,000
Interest Rate
3.95%
Purchase Details
Closed on
Jun 26, 1996
Sold by
T R Trust 07-29-87 and Rosenthal Theodore
Bought by
Smith Joel H
Home Financials for this Owner
Home Financials are based on the most recent Mortgage that was taken out on this home.
Original Mortgage
$99,375
Interest Rate
7.87%
Purchase Details
Closed on
Mar 24, 1988
Create a Home Valuation Report for This Property
The Home Valuation Report is an in-depth analysis detailing your home's value as well as a comparison with similar homes in the area
Home Values in the Area
Average Home Value in this Area
Purchase History
| Date | Buyer | Sale Price | Title Company |
|---|---|---|---|
| Manfredi Family Ltd Partnership | -- | -- | |
| Manfredi Robert | $150,000 | South Coast Title Company | |
| Smith Joel H | $132,500 | Guardian Title Company | |
| -- | $129,900 | -- |
Source: Public Records
Mortgage History
| Date | Status | Borrower | Loan Amount |
|---|---|---|---|
| Previous Owner | Manfredi Robert | $105,000 | |
| Previous Owner | Smith Joel H | $99,375 | |
| Closed | Smith Joel H | $19,875 |
Source: Public Records
Tax History Compared to Growth
Tax History
| Year | Tax Paid | Tax Assessment Tax Assessment Total Assessment is a certain percentage of the fair market value that is determined by local assessors to be the total taxable value of land and additions on the property. | Land | Improvement |
|---|---|---|---|---|
| 2025 | $2,915 | $239,489 | $159,665 | $79,824 |
| 2024 | $2,915 | $234,794 | $156,535 | $78,259 |
| 2023 | $2,851 | $230,191 | $153,466 | $76,725 |
| 2022 | $2,775 | $225,678 | $150,457 | $75,221 |
| 2021 | $2,757 | $221,254 | $147,507 | $73,747 |
| 2020 | $2,723 | $218,986 | $145,995 | $72,991 |
| 2019 | $2,675 | $214,693 | $143,133 | $71,560 |
| 2018 | $2,502 | $210,484 | $140,327 | $70,157 |
| 2017 | $2,443 | $206,358 | $137,576 | $68,782 |
| 2016 | $2,404 | $202,313 | $134,879 | $67,434 |
| 2015 | $2,369 | $199,275 | $132,853 | $66,422 |
| 2014 | $2,332 | $195,372 | $130,251 | $65,121 |
Source: Public Records
Map
Nearby Homes
- 3955 Honeycutt St Unit 201
- 3968 Sequoia St
- 3955 Shasta St
- 4015 Crown Point Dr Unit 308
- 4064 Honeycutt St
- 1703 La Playa Ave Unit B
- 4073 Kendall St Unit 2
- 4036 Shasta St Unit 14
- 4053-55 Jewell St
- 3943 Ingraham St
- 2023 Reed Ave Unit 1A
- 1654 Oliver Ave Unit 6
- 3736 Promontory St
- 3712 Promontory St
- 4037 Haines St
- 3705 Haines St
- 3843 Riviera Dr Unit 1
- 2134 Reed Ave
- 1830 Thomas Ave Unit 3D
- 2028 Thomas Ave Unit 32
- 3833 Lamont St Unit 4C
- 3833 Lamont St Unit 4A
- 3833 Lamont St Unit 4J
- 3833 Lamont St Unit 4H
- 3833 Lamont St Unit 4G
- 3833 Lamont St Unit 4E
- 3833 Lamont St Unit 4D
- 3833 Lamont St Unit 4B
- 3833 Lamont St Unit 2C
- 3833 Lamont St Unit 2B
- 3833 Lamont St Unit 1A
- 3833 Lamont St Unit 1B
- 3833 Lamont St Unit 3A
- 3833 Lamont St Unit 3J
- 3833 Lamont St Unit 3H
- 3833 Lamont St Unit 3G
- 3833 Lamont St Unit 3E
- 3833 Lamont St Unit 3D
- 3833 Lamont St Unit 3C
- 3833 Lamont St Unit 3B