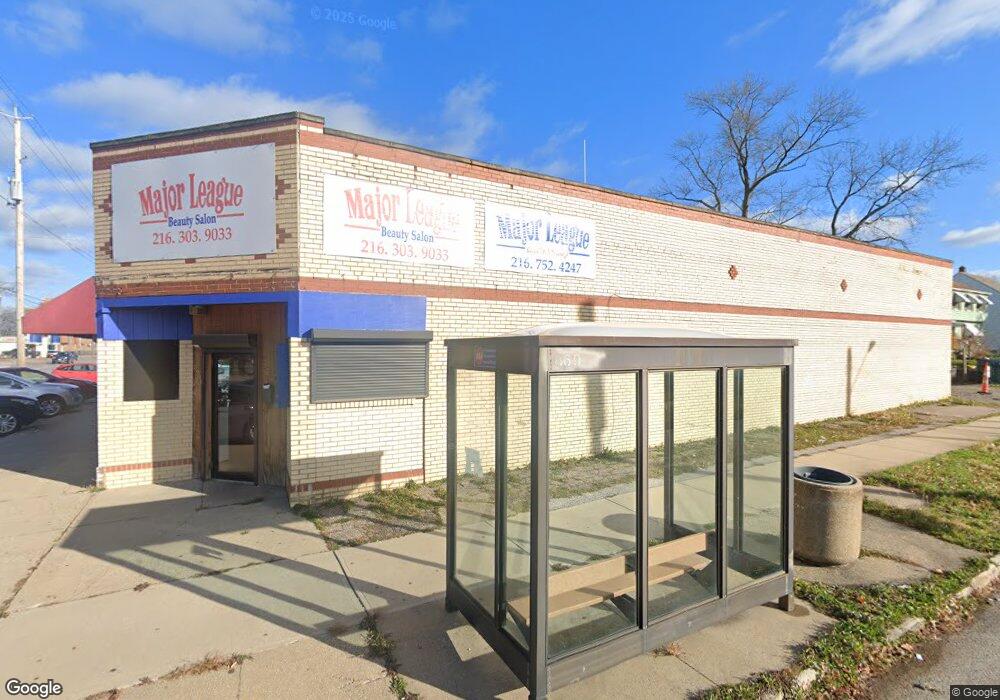
3833 Lee Rd Cleveland, OH 44128
Lee-Miles NeighborhoodEstimated Value: $181,947
--
Bed
--
Bath
7,320
Sq Ft
$25/Sq Ft
Est. Value
About This Home
This home is located at 3833 Lee Rd, Cleveland, OH 44128 and is currently estimated at $181,947, approximately $24 per square foot. 3833 Lee Rd is a home located in Cuyahoga County with nearby schools including Adlai Stevenson School, Andrew J. Rickoff School, and Bolton.
Ownership History
Date
Name
Owned For
Owner Type
Purchase Details
Closed on
Jul 29, 2022
Sold by
Elimimian Solomon
Bought by
56 Acquisitions Lp
Current Estimated Value
Purchase Details
Closed on
Aug 13, 2021
Sold by
Three Black Knights Llc
Bought by
Elimimian Solomon
Purchase Details
Closed on
Mar 5, 2020
Sold by
Urban Leverage Ltd
Bought by
Black Knights Llc
Purchase Details
Closed on
Jan 27, 2020
Sold by
Three Black Knights Llc
Bought by
Urban Leversge Ltd
Purchase Details
Closed on
Jan 6, 2020
Sold by
Thomas Gary and County Of Cuyahoga
Bought by
Three Black Knights Llc
Purchase Details
Closed on
Jul 22, 2003
Sold by
Thomas Darrell
Bought by
Thomas Gary
Purchase Details
Closed on
Jul 10, 2003
Sold by
Estate Of Reola Thomas
Bought by
Thomas Darrell and Thomas Family Trust
Purchase Details
Closed on
Sep 9, 2001
Sold by
Mintz Bill and Mintz Leonard H
Bought by
Thomas Gary and Thomas Reola
Purchase Details
Closed on
Apr 19, 1979
Sold by
Mintz Gertrude
Bought by
Leonard Mintz
Purchase Details
Closed on
Jan 1, 1975
Bought by
Mintz Gertrude
Create a Home Valuation Report for This Property
The Home Valuation Report is an in-depth analysis detailing your home's value as well as a comparison with similar homes in the area
Home Values in the Area
Average Home Value in this Area
Purchase History
| Date | Buyer | Sale Price | Title Company |
|---|---|---|---|
| 56 Acquisitions Lp | -- | Elimimian Solomon | |
| Elimimian Solomon | $140,000 | Affrica Akin | |
| Black Knights Llc | $140,000 | None Available | |
| Urban Leversge Ltd | $140,000 | None Available | |
| Three Black Knights Llc | $40,000 | None Available | |
| Thomas Gary | -- | -- | |
| Thomas Darrell | -- | -- | |
| Thomas Gary | $120,000 | Quality Title Agency Inc | |
| Leonard Mintz | -- | -- | |
| Mintz Gertrude | -- | -- |
Source: Public Records
Tax History Compared to Growth
Tax History
| Year | Tax Paid | Tax Assessment Tax Assessment Total Assessment is a certain percentage of the fair market value that is determined by local assessors to be the total taxable value of land and additions on the property. | Land | Improvement |
|---|---|---|---|---|
| 2024 | $5,343 | $51,765 | $6,720 | $45,045 |
| 2023 | $4,894 | $49,000 | $6,720 | $42,280 |
| 2022 | $4,887 | $49,000 | $6,720 | $42,280 |
| 2021 | $4,901 | $49,000 | $6,720 | $42,280 |
| 2020 | $4,145 | $39,870 | $6,720 | $33,150 |
| 2019 | $3,902 | $113,900 | $19,200 | $94,700 |
| 2018 | $4,215 | $39,870 | $6,720 | $33,150 |
| 2017 | $3,936 | $38,750 | $5,990 | $32,760 |
| 2016 | $3,938 | $38,750 | $5,990 | $32,760 |
| 2015 | $4,488 | $38,750 | $5,990 | $32,760 |
| 2014 | $4,488 | $43,540 | $6,720 | $36,820 |
Source: Public Records
Map
Nearby Homes
- 16317 Throckley Ave
- 16321 Invermere Ave
- 16702 Glendale Ave
- 16204 Invermere Ave
- 16915 Talford Ave
- 16314 Scottsdale Blvd
- 17008 Throckley Ave
- 17104 Throckley Ave
- 16805 Scottsdale Blvd
- 17016 Talford Ave
- 16004 Throckley Ave
- 16100 Scottsdale Blvd
- 3716 Rolliston Rd
- 16110 Biltmore Ave
- 17120 Talford Ave
- 16115 Delrey Ave
- 17211 Walden Ave
- 16109 Delrey Ave
- 17015 Stockbridge Ave
- 3666 Lindholm Rd
- 3819 Lee Rd
- 16511 Walden Ave
- 3815 Lee Rd Unit 3817
- 16515 Walden Ave
- 16512 Walden Ave
- 16512 Throckley Ave
- 3811 Lee Rd
- 16603 Walden Ave
- 16516 Walden Ave
- 16516 Throckley Ave
- 16607 Walden Ave
- 16604 Walden Ave
- 16604 Throckley Ave
- 16608 Walden Ave
- 16608 Throckley Ave
- 16611 Walden Ave
- 16417 Walden Ave
- 16515 Talford Ave
- 16416 Walden Ave
- 16612 Walden Ave