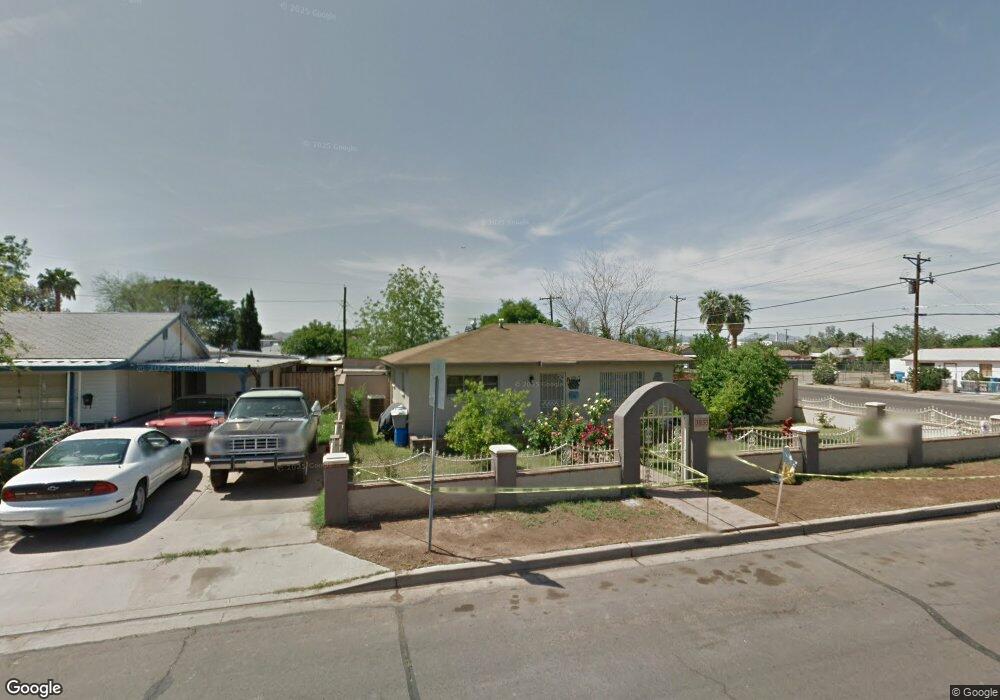
3833 W Polk St Phoenix, AZ 85009
Estrella Village NeighborhoodEstimated Value: $220,000 - $280,000
Studio
1
Bath
1,108
Sq Ft
$234/Sq Ft
Est. Value
About This Home
This home is located at 3833 W Polk St, Phoenix, AZ 85009 and is currently estimated at $259,027, approximately $233 per square foot. 3833 W Polk St is a home located in Maricopa County with nearby schools including Moya Elementary School, Morris K. Udall Middle School, and Carl Hayden High School.
Ownership History
Date
Name
Owned For
Owner Type
Purchase Details
Closed on
Mar 7, 2005
Sold by
Ramirez Ester Cortez and Cortez Ester
Bought by
Cortez Roberto and Moran Roberto Cortez
Current Estimated Value
Home Financials for this Owner
Home Financials are based on the most recent Mortgage that was taken out on this home.
Original Mortgage
$103,000
Outstanding Balance
$52,218
Interest Rate
5.61%
Mortgage Type
Purchase Money Mortgage
Estimated Equity
$206,809
Purchase Details
Closed on
Sep 19, 2001
Sold by
Camelhead Land Fund Llc
Bought by
Great Western Communities
Home Financials for this Owner
Home Financials are based on the most recent Mortgage that was taken out on this home.
Original Mortgage
$83,200
Interest Rate
6.91%
Mortgage Type
Purchase Money Mortgage
Purchase Details
Closed on
May 25, 1998
Sold by
Ramos Cecilio Sanchez
Bought by
Albarran Rodriguez Saturnina
Create a Home Valuation Report for This Property
The Home Valuation Report is an in-depth analysis detailing your home's value as well as a comparison with similar homes in the area
Home Values in the Area
Average Home Value in this Area
Purchase History
| Date | Buyer | Sale Price | Title Company |
|---|---|---|---|
| Cortez Roberto | -- | Security Title Agency Inc | |
| Cortez Roberto | $103,000 | Security Title Agency Inc | |
| Great Western Communities | $29,200 | Lawyers Title Of Arizona Inc | |
| Albarran Rodriguez Saturnina | -- | -- |
Source: Public Records
Mortgage History
| Date | Status | Borrower | Loan Amount |
|---|---|---|---|
| Open | Cortez Roberto | $103,000 | |
| Closed | Cortez Roberto | $103,000 | |
| Previous Owner | Great Western Communities | $83,200 |
Source: Public Records
Tax History
| Year | Tax Paid | Tax Assessment Tax Assessment Total Assessment is a certain percentage of the fair market value that is determined by local assessors to be the total taxable value of land and additions on the property. | Land | Improvement |
|---|---|---|---|---|
| 2025 | $1,206 | $8,211 | -- | -- |
| 2024 | $1,189 | $7,820 | -- | -- |
| 2023 | $1,189 | $18,550 | $3,710 | $14,840 |
| 2022 | $1,127 | $13,600 | $2,720 | $10,880 |
| 2021 | $1,082 | $11,250 | $2,250 | $9,000 |
| 2020 | $1,058 | $10,420 | $2,080 | $8,340 |
| 2019 | $1,035 | $8,510 | $1,700 | $6,810 |
| 2018 | $498 | $8,300 | $1,660 | $6,640 |
| 2017 | $437 | $6,000 | $1,200 | $4,800 |
| 2016 | $424 | $5,660 | $1,130 | $4,530 |
| 2015 | $385 | $4,110 | $820 | $3,290 |
Source: Public Records
Map
Nearby Homes
- 326 N 39th Dr
- 3810 W Van Buren St
- 3607 W Melvin St Unit 5
- 3803 W Portland St
- 4211 W Roosevelt St Unit 1
- 3828 W Latham St
- 3648 W Moreland St
- 4224 W Portland St
- 1340 N 38th Dr
- 1333 N 39th Dr
- 2203 W Jefferson St Unit 1
- 3339 W Washington St Unit 2
- 3237 W Pierce St
- 1328 N 41st Ave
- 3215 W Taylor St
- 3206 W Pierce St
- 1516 N 37th Ave
- 3212 W Jackson St
- 1642 N 38th Ave
- 3033 W Fillmore St
- 3827 W Polk St
- 3821 W Polk St
- 3836 W Melvin St
- 3830 W Melvin St
- 3834 W Polk St
- 3828 W Polk St
- 346 N 39th Ave Unit 15
- 346 N 39th Ave
- 402 N 39th Ave
- 3826 W Melvin St
- 3817 W Polk St
- 336 N 39th Ave Unit 342
- 336 N 39th Ave Unit 16
- 336 N 39th Ave Unit 17
- 3822 W Polk St
- 410 N 39th Ave
- 3820 W Melvin St
- 3811 W Polk St
- 414 N 39th Ave
- 3818 W Polk St
Your Personal Tour Guide
Ask me questions while you tour the home.