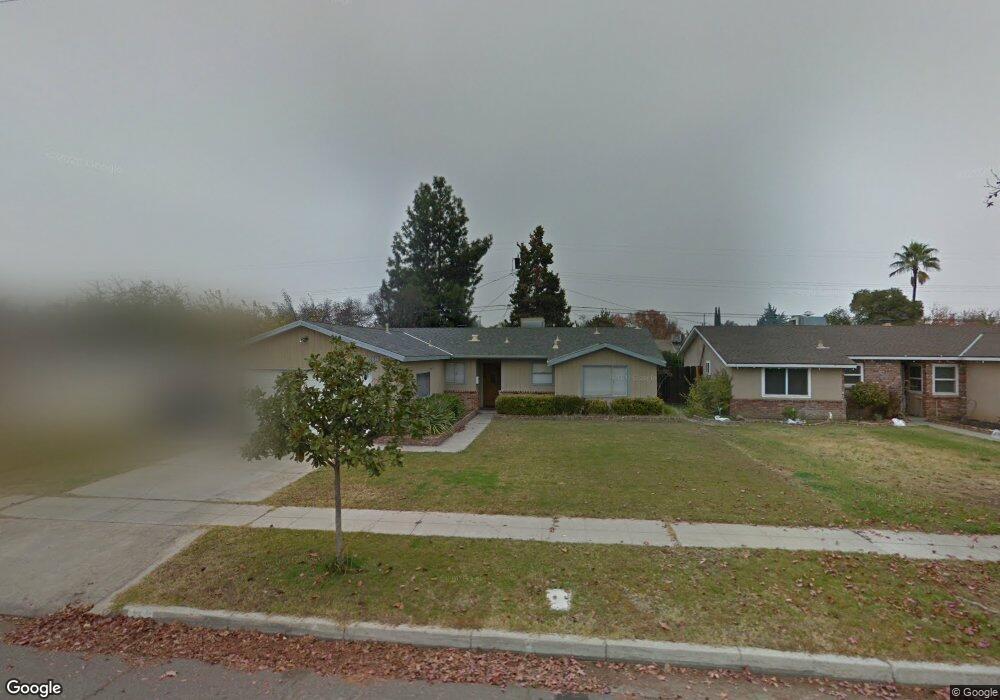
3835 E Richert Ave Fresno, CA 93726
Hoover NeighborhoodEstimated Value: $314,254 - $332,000
3
Beds
2
Baths
1,130
Sq Ft
$288/Sq Ft
Est. Value
About This Home
This home is located at 3835 E Richert Ave, Fresno, CA 93726 and is currently estimated at $325,064, approximately $287 per square foot. 3835 E Richert Ave is a home located in Fresno County with nearby schools including Thomas Elementary School, Tioga Middle School, and Herbert Hoover High School.
Ownership History
Date
Name
Owned For
Owner Type
Purchase Details
Closed on
Feb 27, 2017
Sold by
Beck Jeffrey A and Beck Melanie M
Bought by
Beck Jeffrey A
Current Estimated Value
Purchase Details
Closed on
Dec 5, 1997
Sold by
Beck Jeffrey A and Beck Melanie G
Bought by
Beck Jeffrey A and Beck Melanie G
Home Financials for this Owner
Home Financials are based on the most recent Mortgage that was taken out on this home.
Original Mortgage
$35,000
Outstanding Balance
$5,719
Interest Rate
7.23%
Estimated Equity
$319,345
Purchase Details
Closed on
Feb 16, 1996
Sold by
Beck Melanie G
Bought by
Beck Jeffrey A and Beck Melanie G
Purchase Details
Closed on
Jul 18, 1994
Sold by
Marcure Farrell W and Marcure Lavada J
Bought by
Beck Melanie G
Create a Home Valuation Report for This Property
The Home Valuation Report is an in-depth analysis detailing your home's value as well as a comparison with similar homes in the area
Home Values in the Area
Average Home Value in this Area
Purchase History
| Date | Buyer | Sale Price | Title Company |
|---|---|---|---|
| Beck Jeffrey A | -- | None Available | |
| Beck Jeffrey A | -- | Fidelity National Title Co | |
| Beck Jeffrey A | -- | -- | |
| Beck Melanie G | -- | -- |
Source: Public Records
Mortgage History
| Date | Status | Borrower | Loan Amount |
|---|---|---|---|
| Open | Beck Jeffrey A | $35,000 |
Source: Public Records
Tax History
| Year | Tax Paid | Tax Assessment Tax Assessment Total Assessment is a certain percentage of the fair market value that is determined by local assessors to be the total taxable value of land and additions on the property. | Land | Improvement |
|---|---|---|---|---|
| 2025 | $840 | $63,466 | $12,208 | $51,258 |
| 2023 | $809 | $61,003 | $11,735 | $49,268 |
| 2022 | $783 | $59,807 | $11,505 | $48,302 |
| 2021 | $762 | $58,635 | $11,280 | $47,355 |
| 2020 | $759 | $58,035 | $11,165 | $46,870 |
| 2019 | $730 | $56,898 | $10,947 | $45,951 |
| 2018 | $715 | $55,783 | $10,733 | $45,050 |
| 2017 | $703 | $54,690 | $10,523 | $44,167 |
| 2016 | $680 | $53,618 | $10,317 | $43,301 |
| 2015 | $670 | $52,814 | $10,163 | $42,651 |
| 2014 | $658 | $51,780 | $9,964 | $41,816 |
Source: Public Records
Map
Nearby Homes
- 3915 E Holland Ave
- 3763 E Swift Ave
- 4161 E Holland Ave
- 3654 E Donner Ave
- 4104 E Ashlan Ave
- 3789 E Hampton Way
- 4365 N 5th St
- 4281 N 5th St
- 4295 N Archie Ave
- 3719 E Hampton Way Unit 2
- 4045 E Bellaire Way
- 4324 E Richert Ave
- 3860 E Rialto Ave
- 3934 E Sussex Way
- 4342 E Donner Ave
- 4031 E Pontiac Way
- 4656 N 5th St
- 3365 E Ashlan Ave
- 4727 N Cedar Ave Unit 107
- 4052 E Farrin Ave
- 3845 E Richert Ave
- 3825 E Richert Ave
- 3834 E Holland Ave
- 3855 E Richert Ave
- 3815 E Richert Ave
- 3824 E Holland Ave
- 3814 E Holland Ave
- 3846 E Richert Ave
- 3826 E Richert Ave
- 3865 E Richert Ave
- 3805 E Richert Ave
- 3856 E Richert Ave
- 3816 E Richert Ave
- 3804 E Holland Ave
- 3864 E Holland Ave
- 3875 E Richert Ave
- 3791 E Richert Ave
- 3866 E Richert Ave
- 3806 E Richert Ave
- 3794 E Holland Ave
Your Personal Tour Guide
Ask me questions while you tour the home.