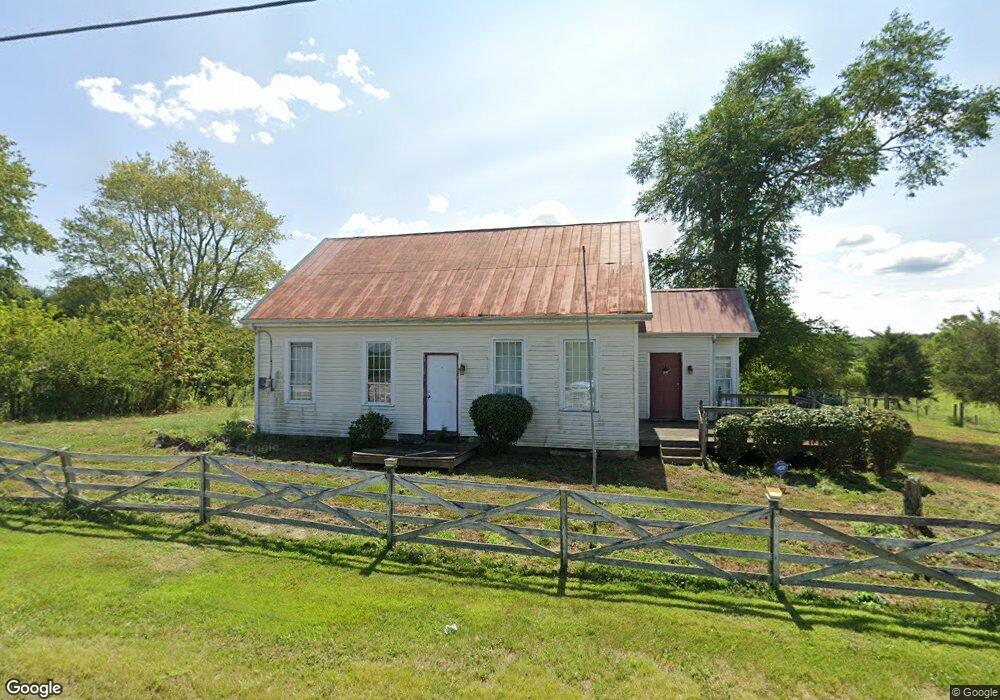
3835 State Route 756 Felicity, OH 45120
Estimated Value: $191,000 - $208,000
3
Beds
1
Bath
1,350
Sq Ft
$147/Sq Ft
Est. Value
About This Home
This home is located at 3835 State Route 756, Felicity, OH 45120 and is currently estimated at $198,256, approximately $146 per square foot. 3835 State Route 756 is a home located in Clermont County with nearby schools including Felicity-Franklin Local Elementary School, Felicity-Franklin Local Middle School, and Felicity-Franklin Local High School.
Ownership History
Date
Name
Owned For
Owner Type
Purchase Details
Closed on
Nov 12, 2025
Sold by
Gegato Jean Paul A
Bought by
Werring Gerald L and Werring Stacie A
Current Estimated Value
Purchase Details
Closed on
Nov 30, 2010
Sold by
Wallace Jason M
Bought by
Gegato Jean Paul A
Home Financials for this Owner
Home Financials are based on the most recent Mortgage that was taken out on this home.
Original Mortgage
$55,000
Interest Rate
4.22%
Mortgage Type
New Conventional
Purchase Details
Closed on
Sep 8, 2009
Sold by
Naylor Wayne
Bought by
Wallace Jason M
Home Financials for this Owner
Home Financials are based on the most recent Mortgage that was taken out on this home.
Original Mortgage
$64,804
Interest Rate
5.32%
Mortgage Type
FHA
Purchase Details
Closed on
May 23, 2006
Sold by
Orme Melinda
Bought by
Naylor Wayne
Purchase Details
Closed on
Jul 23, 1997
Sold by
Jarman John K
Bought by
Orme Richard D and Orme Melinda K
Purchase Details
Closed on
Dec 12, 1991
Create a Home Valuation Report for This Property
The Home Valuation Report is an in-depth analysis detailing your home's value as well as a comparison with similar homes in the area
Home Values in the Area
Average Home Value in this Area
Purchase History
| Date | Buyer | Sale Price | Title Company |
|---|---|---|---|
| Werring Gerald L | $70,000 | None Listed On Document | |
| Gegato Jean Paul A | $75,000 | Attorney | |
| Wallace Jason M | $66,000 | Attorney | |
| Naylor Wayne | $27,000 | None Available | |
| Orme Richard D | $42,500 | -- | |
| -- | $65,000 | -- |
Source: Public Records
Mortgage History
| Date | Status | Borrower | Loan Amount |
|---|---|---|---|
| Previous Owner | Gegato Jean Paul A | $55,000 | |
| Previous Owner | Wallace Jason M | $64,804 | |
| Closed | Orme Richard D | $0 |
Source: Public Records
Tax History Compared to Growth
Tax History
| Year | Tax Paid | Tax Assessment Tax Assessment Total Assessment is a certain percentage of the fair market value that is determined by local assessors to be the total taxable value of land and additions on the property. | Land | Improvement |
|---|---|---|---|---|
| 2024 | $1,361 | $41,240 | $15,300 | $25,940 |
| 2023 | $1,371 | $41,240 | $15,300 | $25,940 |
| 2022 | $1,230 | $33,710 | $12,500 | $21,210 |
| 2021 | $1,231 | $33,710 | $12,500 | $21,210 |
| 2020 | $1,228 | $33,710 | $12,500 | $21,210 |
| 2019 | $1,158 | $30,320 | $12,430 | $17,890 |
| 2018 | $1,158 | $30,320 | $12,430 | $17,890 |
| 2017 | $993 | $30,320 | $12,430 | $17,890 |
| 2016 | $993 | $24,260 | $9,940 | $14,320 |
| 2015 | $923 | $24,260 | $9,940 | $14,320 |
| 2014 | $923 | $24,260 | $9,940 | $14,320 |
| 2013 | $621 | $15,270 | $12,570 | $2,700 |
Source: Public Records
Map
Nearby Homes
- 650 Ohio 756
- 1606 Lenroot Rd
- 7809 Ohio 505
- 1630 Trisler Rd
- 3569 Smyrna Rd
- 1504 Feesburg-Poetown Rd
- 0 Black Oak Ln
- 403 Felicity Higginsport Rd
- 1921 Bethel Maple Rd
- 7.43 Ac Swope Rd
- 104 Country Way Ln
- 1679 Swope Rd
- 1614 Ohio 133
- 1619 Ohio 133
- 3299 Ohio 756
- 3202 Beech Rd
- 714 West St
- 1308 Skiffsville Rd
- 715 Walnut St
- ac Beech Rd
- 3835 State Route 756
- 3839 State Route 756
- 5.81ac Griffith Rd
- 3843 State Route 756
- 3847 State Route 756
- 3847 State Route 756
- 3817 State Route 756
- 3817 State Route 756
- 8073 Griffith Rd
- 536 State Route 756
- 536 State Route 756
- 550 State Route 756
- 3813 State Route 756
- 554 State Route 756
- 554 St Rt 756
- 3806 State Route 756
- 682 Ohio 756
- 684 State Route 756
- 660 State Route 756
- 670 State Route 756