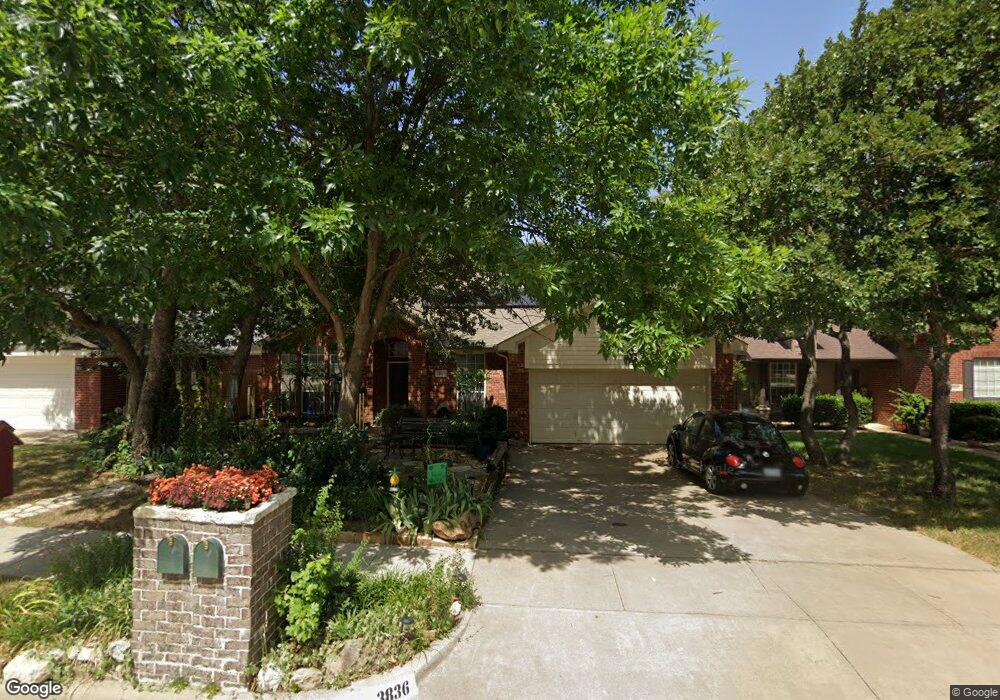
3836 Chimney Rock Dr Denton, TX 76210
South Denton NeighborhoodEstimated Value: $330,000 - $376,000
3
Beds
2
Baths
2,021
Sq Ft
$175/Sq Ft
Est. Value
About This Home
This home is located at 3836 Chimney Rock Dr, Denton, TX 76210 and is currently estimated at $353,143, approximately $174 per square foot. 3836 Chimney Rock Dr is a home located in Denton County with nearby schools including Nelson Elementary School, McMath Middle School, and Denton High School.
Ownership History
Date
Name
Owned For
Owner Type
Purchase Details
Closed on
Jan 18, 2023
Sold by
Duteil Mary Ann
Bought by
Duteil Mary Ann and Buffington Allen Joseph
Current Estimated Value
Home Financials for this Owner
Home Financials are based on the most recent Mortgage that was taken out on this home.
Original Mortgage
$20,000
Interest Rate
5.93%
Mortgage Type
Credit Line Revolving
Purchase Details
Closed on
May 31, 2001
Sold by
Slane Charles Littleton
Bought by
Slane Mary Ann
Purchase Details
Closed on
Nov 17, 1999
Sold by
Choice Home Inc
Bought by
Slane Mary Ann
Home Financials for this Owner
Home Financials are based on the most recent Mortgage that was taken out on this home.
Original Mortgage
$81,544
Interest Rate
7.83%
Mortgage Type
FHA
Create a Home Valuation Report for This Property
The Home Valuation Report is an in-depth analysis detailing your home's value as well as a comparison with similar homes in the area
Home Values in the Area
Average Home Value in this Area
Purchase History
| Date | Buyer | Sale Price | Title Company |
|---|---|---|---|
| Duteil Mary Ann | -- | None Listed On Document | |
| Slane Mary Ann | -- | -- | |
| Slane Mary Ann | -- | -- | |
| Slane Mary Ann | -- | -- | |
| Slane Mary Ann | -- | -- |
Source: Public Records
Mortgage History
| Date | Status | Borrower | Loan Amount |
|---|---|---|---|
| Previous Owner | Duteil Mary Ann | $20,000 | |
| Previous Owner | Slane Mary Ann | $81,544 |
Source: Public Records
Tax History Compared to Growth
Tax History
| Year | Tax Paid | Tax Assessment Tax Assessment Total Assessment is a certain percentage of the fair market value that is determined by local assessors to be the total taxable value of land and additions on the property. | Land | Improvement |
|---|---|---|---|---|
| 2025 | $2,854 | $355,244 | $81,071 | $274,173 |
| 2024 | $6,739 | $349,159 | $0 | $0 |
| 2023 | $2,859 | $317,417 | $81,071 | $279,535 |
| 2022 | $6,126 | $288,561 | $63,922 | $224,639 |
| 2021 | $5,842 | $271,139 | $43,654 | $227,485 |
| 2020 | $5,461 | $238,910 | $43,654 | $195,256 |
| 2019 | $5,668 | $237,541 | $43,654 | $196,371 |
| 2018 | $5,217 | $215,946 | $43,654 | $172,292 |
| 2017 | $5,010 | $202,684 | $37,418 | $168,161 |
| 2016 | $4,479 | $184,258 | $37,418 | $152,116 |
| 2015 | $3,544 | $167,507 | $37,418 | $132,334 |
| 2013 | -- | $138,435 | $37,418 | $101,017 |
Source: Public Records
Map
Nearby Homes
- 2617 Bissonet Dr
- 2616 Hilcroft Ave
- 2713 Hilcroft Ave
- 2804 Hollow Ridge Dr
- 2617 Hollow Ridge Dr
- 3900 Gessner Dr
- 2817 Hereford Rd
- 2617 Hereford Rd
- 3448 Tuscan Hills Cir
- 2721 Arabian Ave
- 3000 Bella Lago Dr
- 3428 Tuscan Hills Cir
- 2913 Montebello Dr
- 2601 Pinto Dr
- 2917 Montebello Dr
- 3009 Montebello Dr
- 2713 Clubhouse Dr
- 3933 Parkhaven Dr
- 2121 Corsair Ln
- 3237 Clydesdale Dr
- 3840 Chimney Rock Dr
- 3832 Chimney Rock Dr
- 3844 Chimney Rock Dr
- 3828 Chimney Rock Dr
- 3833 Willowick Cir
- 3837 Chimney Rock Dr
- 3848 Chimney Rock Dr
- 3841 Chimney Rock Dr
- 3829 Willowick Cir
- 3824 Chimney Rock Dr
- 3829 Chimney Rock Dr
- 3845 Chimney Rock Dr
- 3825 Willowick Cir
- 3852 Chimney Rock Dr
- 3820 Chimney Rock Dr
- 3825 Chimney Rock Dr
- 3849 Chimney Rock Dr
- 3821 Willowick Cir
- 3836 Kirby Dr
- 3832 Kirby Dr