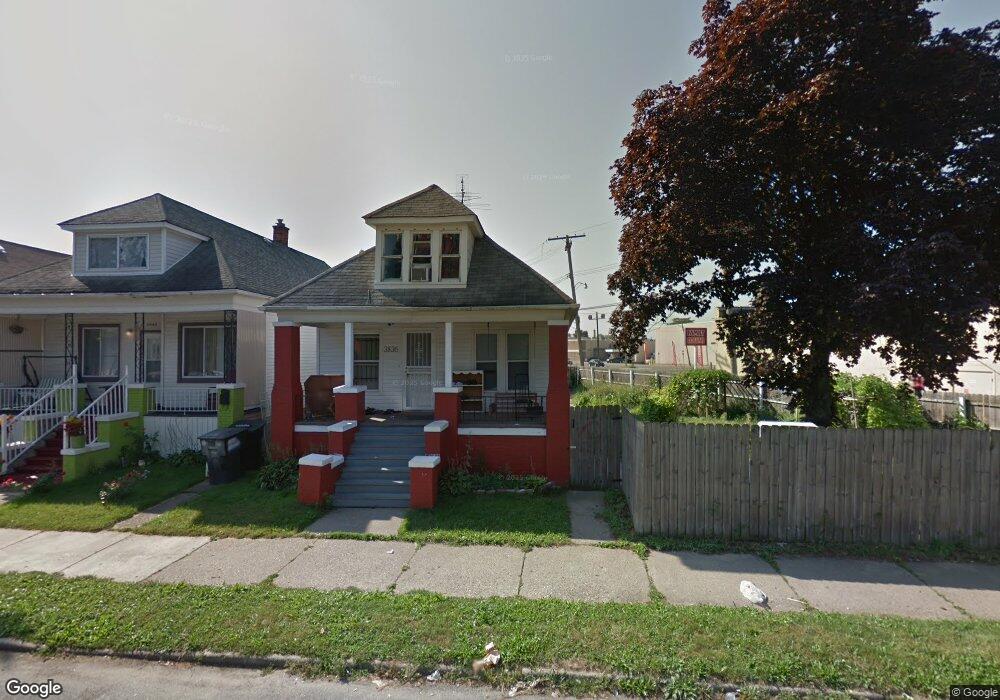
3836 Garvin St HamtraMcK, MI 48212
Buffalo Charles NeighborhoodEstimated Value: $105,000 - $160,000
3
Beds
1
Bath
943
Sq Ft
$150/Sq Ft
Est. Value
About This Home
This home is located at 3836 Garvin St, HamtraMcK, MI 48212 and is currently estimated at $141,131, approximately $149 per square foot. 3836 Garvin St is a home located in Wayne County with nearby schools including Davison Elementary-Middle School, Edward 'Duke' Ellington Conservatory of Music and Art, and Charles L. Spain Elementary-Middle School.
Ownership History
Date
Name
Owned For
Owner Type
Purchase Details
Closed on
May 24, 2016
Sold by
Miah Md Faruk and Akter Sofia
Bought by
Ahmed Kunu
Current Estimated Value
Purchase Details
Closed on
May 13, 2011
Sold by
Choudhury Nuruzzaman
Bought by
Miah Faruk and Akter Safha
Purchase Details
Closed on
Nov 12, 2009
Sold by
Hussain Mohammed and Choudhury Nuruzzaman
Bought by
Choudhury Nuruzzaman
Purchase Details
Closed on
Apr 8, 2002
Sold by
Dnr
Bought by
Zaliwski Leanne
Purchase Details
Closed on
Jun 12, 1994
Sold by
Block Paul
Bought by
Dale M Mottausch
Create a Home Valuation Report for This Property
The Home Valuation Report is an in-depth analysis detailing your home's value as well as a comparison with similar homes in the area
Home Values in the Area
Average Home Value in this Area
Purchase History
| Date | Buyer | Sale Price | Title Company |
|---|---|---|---|
| Ahmed Kunu | $41,000 | Michigan Investment Title In | |
| Miah Faruk | $15,000 | None Available | |
| Choudhury Nuruzzaman | -- | Progressive Title | |
| Hussain Mohammed | $15,000 | Progressive Title | |
| Zaliwski Leanne | -- | -- | |
| Dale M Mottausch | $10,000 | -- |
Source: Public Records
Tax History
| Year | Tax Paid | Tax Assessment Tax Assessment Total Assessment is a certain percentage of the fair market value that is determined by local assessors to be the total taxable value of land and additions on the property. | Land | Improvement |
|---|---|---|---|---|
| 2025 | $781 | $41,400 | $0 | $0 |
| 2024 | $783 | $26,400 | $0 | $0 |
| 2023 | $758 | $21,400 | $0 | $0 |
| 2022 | $819 | $16,000 | $0 | $0 |
| 2021 | $802 | $11,600 | $0 | $0 |
| 2020 | $794 | $10,800 | $0 | $0 |
| 2019 | $784 | $8,900 | $0 | $0 |
| 2018 | $684 | $8,000 | $0 | $0 |
| 2017 | $140 | $7,400 | $0 | $0 |
| 2016 | $1,012 | $18,200 | $0 | $0 |
| 2015 | $1,280 | $12,800 | $0 | $0 |
| 2013 | $1,419 | $14,193 | $0 | $0 |
| 2010 | -- | $20,809 | $1,038 | $19,771 |
Source: Public Records
Map
Nearby Homes
- 3875 Sobieski St
- 4994 Carpenter Ave
- 12309 Klinger St
- 3935 Caely St
- 4590 Charles St
- 12099 Klinger St
- 3346 Meade St
- 12621 Moran St
- 12511 Gallagher St
- 12091 Sobieski St
- 5092 Charles St
- 13401 Justine St
- 12660 Gallagher St
- 11711 Moran St
- 13402 Dean St
- 11697 Moran St
- 11730 Sobieski St
- 11809 Conant St
- 5021 Talbot St
- 11651 Moran St
- 3840 Garvin St
- 3846 Garvin St
- 3854 Garvin St
- 3829 Garvin St
- 3845 Garvin St
- 3860 Garvin St
- 3829 Sobieski St
- 3853 Garvin St
- 3866 Garvin St
- 3835 Sobieski St
- 3865 Garvin St
- 12460 Conant St
- 3841 Sobieski St
- 3872 Garvin St
- 3871 Garvin St
- 3878 Garvin St
- 3877 Garvin St
- 3853 Sobieski St
- 3850 Charles St
- 3860 Charles St
Your Personal Tour Guide
Ask me questions while you tour the home.