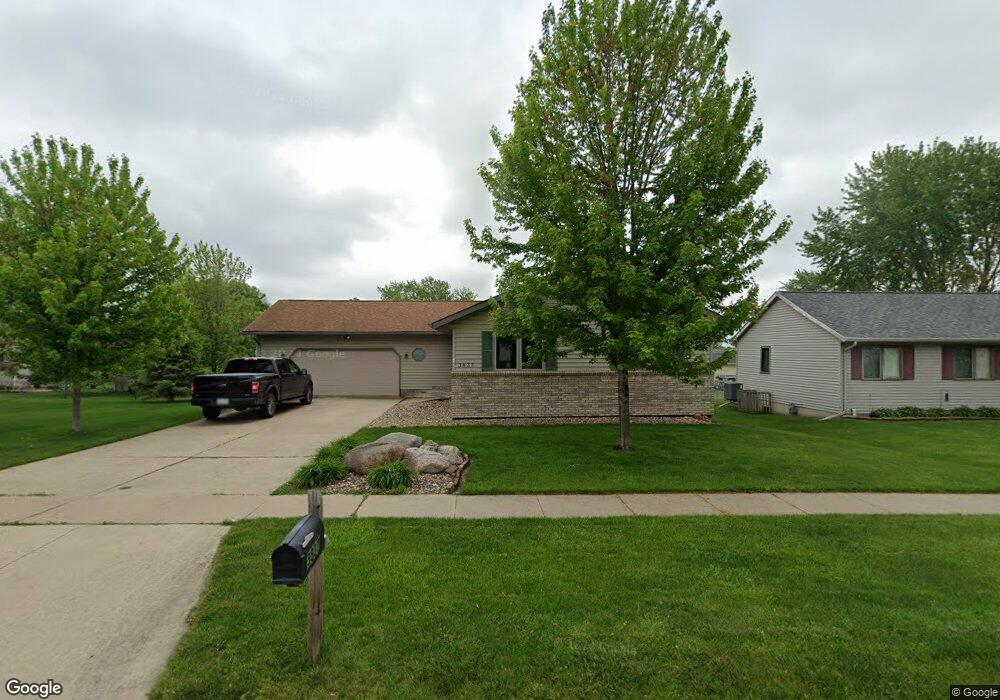
3837 Tami Terrace Waterloo, IA 50702
Estimated Value: $284,000 - $291,126
4
Beds
3
Baths
2,226
Sq Ft
$130/Sq Ft
Est. Value
About This Home
This home is located at 3837 Tami Terrace, Waterloo, IA 50702 and is currently estimated at $288,532, approximately $129 per square foot. 3837 Tami Terrace is a home located in Black Hawk County with nearby schools including Lou Henry Elementary School, Hoover Middle School, and West High School.
Ownership History
Date
Name
Owned For
Owner Type
Purchase Details
Closed on
Apr 16, 2021
Sold by
Kraus Robert E and Kraus Naomi A
Bought by
Kraus Robert E and Kraus Naomi A
Current Estimated Value
Home Financials for this Owner
Home Financials are based on the most recent Mortgage that was taken out on this home.
Original Mortgage
$160,000
Outstanding Balance
$144,265
Interest Rate
3.05%
Mortgage Type
New Conventional
Estimated Equity
$144,267
Purchase Details
Closed on
Jun 25, 2013
Sold by
Circuit Properties Iowa Llc
Bought by
Kraus Robert E
Home Financials for this Owner
Home Financials are based on the most recent Mortgage that was taken out on this home.
Original Mortgage
$143,200
Interest Rate
4.5%
Mortgage Type
Adjustable Rate Mortgage/ARM
Purchase Details
Closed on
May 10, 2011
Sold by
Bultsma Peter and Baltsma Pete
Bought by
Circuit Properties Iowa Llc
Purchase Details
Closed on
Nov 15, 2010
Sold by
Riedl Jill M
Bought by
Baltsma Pete
Create a Home Valuation Report for This Property
The Home Valuation Report is an in-depth analysis detailing your home's value as well as a comparison with similar homes in the area
Home Values in the Area
Average Home Value in this Area
Purchase History
| Date | Buyer | Sale Price | Title Company |
|---|---|---|---|
| Kraus Robert E | -- | None Available | |
| Kraus Robert E | $179,000 | None Available | |
| Circuit Properties Iowa Llc | -- | None Available | |
| Baltsma Pete | $166,000 | None Available |
Source: Public Records
Mortgage History
| Date | Status | Borrower | Loan Amount |
|---|---|---|---|
| Open | Kraus Robert E | $160,000 | |
| Closed | Kraus Robert E | $143,200 |
Source: Public Records
Tax History Compared to Growth
Tax History
| Year | Tax Paid | Tax Assessment Tax Assessment Total Assessment is a certain percentage of the fair market value that is determined by local assessors to be the total taxable value of land and additions on the property. | Land | Improvement |
|---|---|---|---|---|
| 2025 | $5,598 | $271,030 | $32,080 | $238,950 |
| 2024 | $5,598 | $258,050 | $32,080 | $225,970 |
| 2023 | $4,348 | $247,530 | $32,080 | $215,450 |
| 2022 | $4,232 | $197,930 | $32,080 | $165,850 |
| 2021 | $4,082 | $197,930 | $32,080 | $165,850 |
| 2020 | $4,016 | $180,200 | $22,640 | $157,560 |
| 2019 | $4,016 | $180,200 | $22,640 | $157,560 |
| 2018 | $4,018 | $180,200 | $22,640 | $157,560 |
| 2017 | $4,138 | $180,200 | $22,640 | $157,560 |
| 2016 | $4,088 | $180,200 | $22,640 | $157,560 |
| 2015 | $4,088 | $180,200 | $22,640 | $157,560 |
| 2014 | $4,166 | $180,200 | $22,640 | $157,560 |
Source: Public Records
Map
Nearby Homes
- 706 Wildwood Rd
- 3124 W 9th St
- 3057 San Salvador Dr
- 3058 San Salvador Dr
- 3256 Hammond Ave
- 0 Alexandra Dr
- 3420 Crown Ct Unit 3420
- 1119 Kaplan Dr
- 2415 Saratoga Dr
- 2705 Crestline Ave
- 1123 E Ridgeway Ave
- 1145 E Ridgeway Ave
- 135 E San Marnan Dr Unit 6
- 1124 Oleson Rd
- 1152 Wisner Dr
- 610 Burbank Ave
- 1407 Hummingbird Cir
- 1004 Hummingbird Cir
- 2547 W 9th St
- Lot 6 Mirage Ridge
- 3845 Tami Terrace
- 3853 Tami Terrace
- 3836 Holly Ln
- 3844 Holly Ln
- 3830 Holly Ln
- 3823 Tami Terrace
- 3830 Tami Terrace Unit 3832
- 3836 Tami Terrace
- 3852 Holly Ln
- 3822 Holly Ln
- 3859 Tami Terrace Unit 3861
- 3846 Tami Terrace
- 3822 Tami Terrace Unit 3824
- 3811 Tami Terrace
- 3852 Tami Terrace
- 616 Wildwood Rd
- 3860 Holly Ln
- 626 Wildwood Rd
- 3810 Tami Terrace
- 3860 Tami Terrace