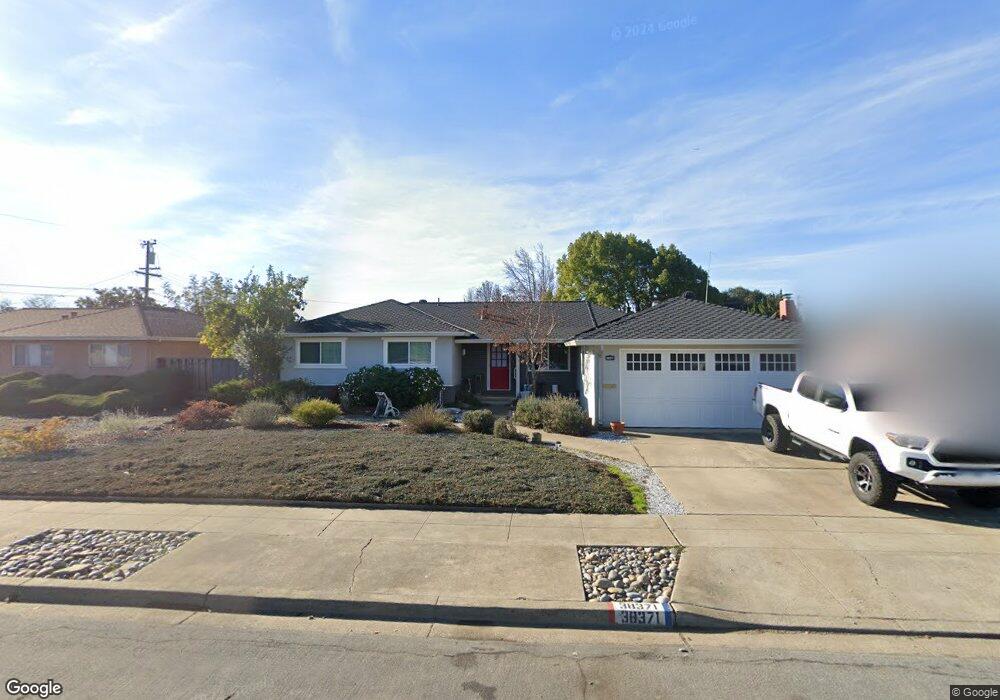
38371 Alta Dr Fremont, CA 94536
Glenmoor NeighborhoodEstimated Value: $1,698,882 - $2,109,000
3
Beds
2
Baths
1,594
Sq Ft
$1,168/Sq Ft
Est. Value
About This Home
This home is located at 38371 Alta Dr, Fremont, CA 94536 and is currently estimated at $1,861,221, approximately $1,167 per square foot. 38371 Alta Dr is a home located in Alameda County with nearby schools including John G. Mattos Elementary School, G.M. Walters Middle School, and John F. Kennedy High School.
Ownership History
Date
Name
Owned For
Owner Type
Purchase Details
Closed on
Oct 30, 2014
Sold by
Ibarreta Melvin
Bought by
Ibarreta Melvin
Current Estimated Value
Home Financials for this Owner
Home Financials are based on the most recent Mortgage that was taken out on this home.
Original Mortgage
$587,250
Outstanding Balance
$448,522
Interest Rate
3.92%
Mortgage Type
VA
Estimated Equity
$1,412,699
Purchase Details
Closed on
Jun 26, 2014
Sold by
Lewis Kimberly Kay and Rodriguez Tricia Kristine
Bought by
Ibarreta Melvin and Ibarreta Renato L
Home Financials for this Owner
Home Financials are based on the most recent Mortgage that was taken out on this home.
Original Mortgage
$583,950
Interest Rate
4.09%
Mortgage Type
New Conventional
Purchase Details
Closed on
Mar 18, 2008
Sold by
Lewis Stanley C and Lewis Faye N
Bought by
Lewis Stanley C and Lewis Faye N
Create a Home Valuation Report for This Property
The Home Valuation Report is an in-depth analysis detailing your home's value as well as a comparison with similar homes in the area
Home Values in the Area
Average Home Value in this Area
Purchase History
| Date | Buyer | Sale Price | Title Company |
|---|---|---|---|
| Ibarreta Melvin | -- | Nextitle | |
| Ibarreta Melvin | -- | Nextitle | |
| Ibarreta Melvin | $649,000 | Old Republic Title Company | |
| Ibarreta Melvin | -- | Old Republic Title Company | |
| Lewis Stanley C | -- | None Available |
Source: Public Records
Mortgage History
| Date | Status | Borrower | Loan Amount |
|---|---|---|---|
| Open | Ibarreta Melvin | $587,250 | |
| Closed | Ibarreta Melvin | $583,950 |
Source: Public Records
Tax History
| Year | Tax Paid | Tax Assessment Tax Assessment Total Assessment is a certain percentage of the fair market value that is determined by local assessors to be the total taxable value of land and additions on the property. | Land | Improvement |
|---|---|---|---|---|
| 2025 | $10,831 | $901,356 | $292,039 | $609,317 |
| 2024 | $10,831 | $883,686 | $286,314 | $597,372 |
| 2023 | $10,543 | $866,362 | $280,701 | $585,661 |
| 2022 | $10,410 | $849,374 | $275,197 | $574,177 |
| 2021 | $10,155 | $832,724 | $269,802 | $562,922 |
| 2020 | $10,192 | $824,189 | $267,037 | $557,152 |
| 2019 | $10,076 | $808,034 | $261,803 | $546,231 |
| 2018 | $9,881 | $792,194 | $256,671 | $535,523 |
| 2017 | $9,634 | $776,661 | $251,638 | $525,023 |
| 2016 | $9,473 | $761,436 | $246,705 | $514,731 |
| 2015 | $8,915 | $720,000 | $216,000 | $504,000 |
| 2014 | $1,363 | $78,203 | $25,001 | $53,202 |
Source: Public Records
Map
Nearby Homes
- 38249 Alta Dr
- 5229 Sabin Ave
- 38573 Farwell Dr
- 5172 Selma Ave
- 5238 Brophy Dr
- 38373 Amaranto St
- 38379 Amaranto St
- 38445 Amaranto St
- 38475 Amaranto St
- 38463 Amaranto St
- 38409 Amaranto St
- 38403 Amaranto St
- 5268 Keeler Ct
- 38509 Amaranto St
- 38515 Amaranto St
- 38539 Amaranto St
- 5502 Higo Way
- 5513 Higo Way
- 5516 Higo Way
- 5550 Higo Way
- 38383 Alta Dr
- 38359 Alta Dr
- 38368 Ballard Dr
- 38356 Ballard Dr
- 38347 Alta Dr
- 5144 Sabin Ave
- 38395 Alta Dr
- 5129 Eggers Dr
- 38344 Ballard Dr
- 5143 Eggers Dr
- 38396 Alta Dr
- 5130 Racine Ave
- 5158 Sabin Ave
- 38332 Ballard Dr
- 5157 Eggers Dr
- 38355 Ballard Dr
- 5061 Eggers Dr
- 38334 Alta Dr
- 5172 Sabin Ave
- 5124 Eggers Dr
Your Personal Tour Guide
Ask me questions while you tour the home.