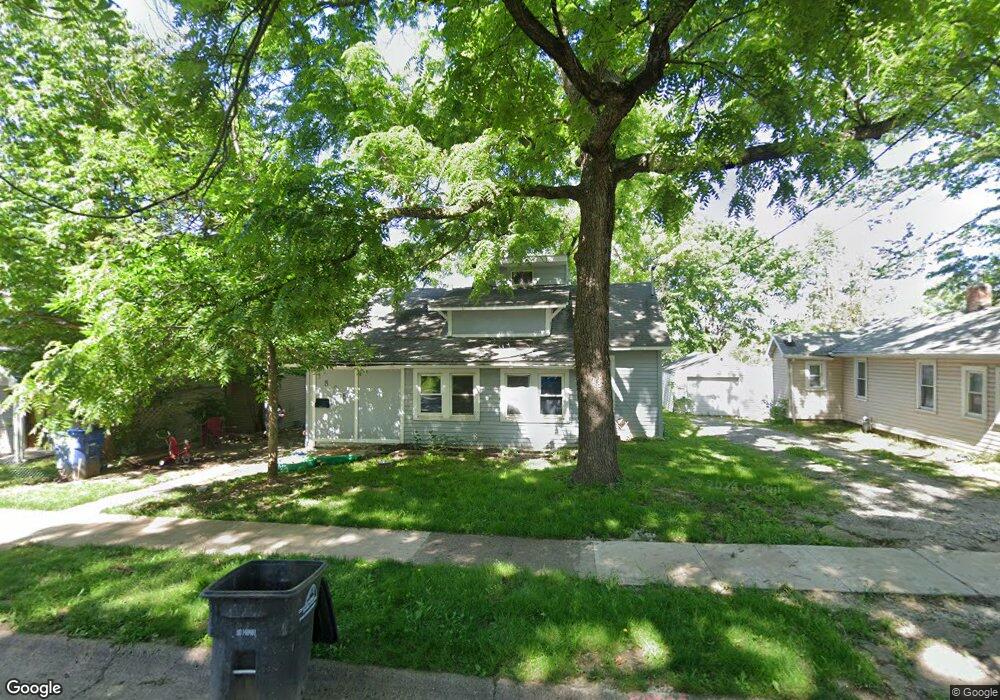
3838 15th St Des Moines, IA 50313
Oak Park NeighborhoodEstimated Value: $138,000 - $169,000
2
Beds
1
Bath
1,013
Sq Ft
$153/Sq Ft
Est. Value
About This Home
This home is located at 3838 15th St, Des Moines, IA 50313 and is currently estimated at $155,474, approximately $153 per square foot. 3838 15th St is a home located in Polk County with nearby schools including Oak Park Elementary School, Harding Middle School, and North High School.
Ownership History
Date
Name
Owned For
Owner Type
Purchase Details
Closed on
Aug 18, 2008
Sold by
Burke Marina L and Burke Anthony
Bought by
Oeth Gary
Current Estimated Value
Purchase Details
Closed on
Nov 16, 2000
Sold by
Burke Anthony M and Burke Anthony
Bought by
Burke Marina L
Purchase Details
Closed on
Jul 18, 1997
Sold by
Thomas Lewis A
Bought by
Armstrong Ronald N and Armstrong Beverly J
Home Financials for this Owner
Home Financials are based on the most recent Mortgage that was taken out on this home.
Original Mortgage
$50,400
Interest Rate
7.94%
Purchase Details
Closed on
Jun 30, 1997
Sold by
Armstrong Ronald N and Armstrong Beverly J
Bought by
Burke Anthony and Burke Mariana L
Home Financials for this Owner
Home Financials are based on the most recent Mortgage that was taken out on this home.
Original Mortgage
$50,400
Interest Rate
7.94%
Create a Home Valuation Report for This Property
The Home Valuation Report is an in-depth analysis detailing your home's value as well as a comparison with similar homes in the area
Home Values in the Area
Average Home Value in this Area
Purchase History
| Date | Buyer | Sale Price | Title Company |
|---|---|---|---|
| Oeth Gary | $4,500 | None Available | |
| Burke Marina L | -- | -- | |
| Armstrong Ronald N | $24,500 | -- | |
| Burke Anthony | $44,500 | -- |
Source: Public Records
Mortgage History
| Date | Status | Borrower | Loan Amount |
|---|---|---|---|
| Previous Owner | Burke Anthony | $50,400 |
Source: Public Records
Tax History Compared to Growth
Tax History
| Year | Tax Paid | Tax Assessment Tax Assessment Total Assessment is a certain percentage of the fair market value that is determined by local assessors to be the total taxable value of land and additions on the property. | Land | Improvement |
|---|---|---|---|---|
| 2025 | $2,314 | $135,100 | $29,200 | $105,900 |
| 2024 | $2,314 | $117,600 | $25,400 | $92,200 |
| 2023 | $2,208 | $117,600 | $25,400 | $92,200 |
| 2022 | $2,192 | $93,700 | $21,400 | $72,300 |
| 2021 | $2,078 | $93,700 | $21,400 | $72,300 |
| 2020 | $2,160 | $83,300 | $19,200 | $64,100 |
| 2019 | $2,058 | $83,300 | $19,200 | $64,100 |
| 2018 | $2,038 | $76,600 | $17,400 | $59,200 |
| 2017 | $1,876 | $76,600 | $17,400 | $59,200 |
| 2016 | $1,828 | $69,400 | $15,700 | $53,700 |
| 2015 | $1,828 | $69,400 | $15,700 | $53,700 |
| 2014 | $1,758 | $66,200 | $14,800 | $51,400 |
Source: Public Records
Map
Nearby Homes