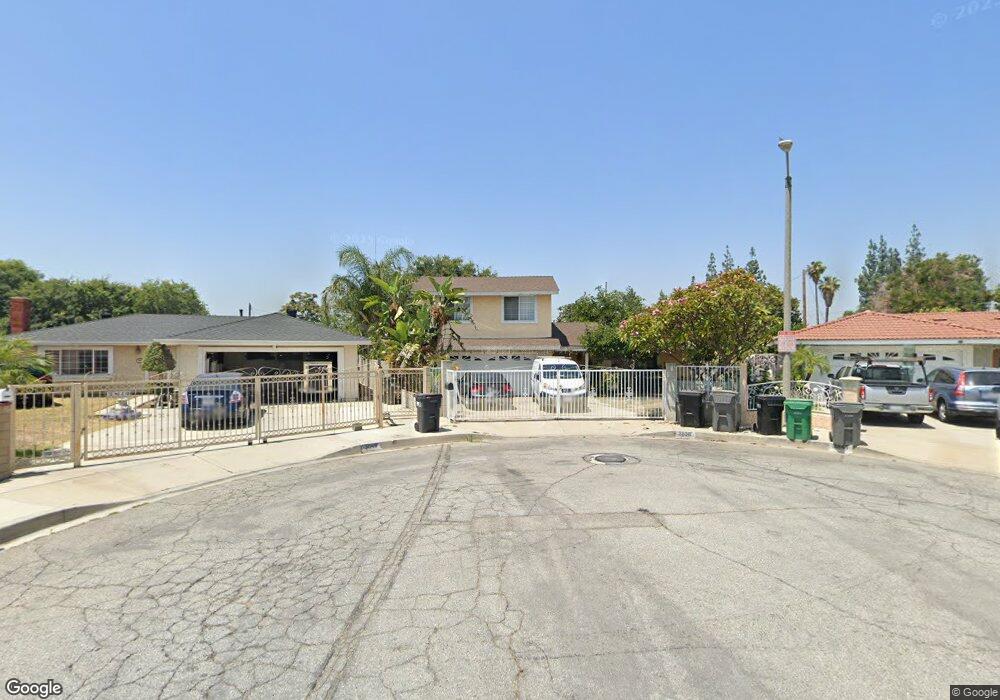
3838 Saint James Cir Baldwin Park, CA 91706
Estimated Value: $644,672 - $902,000
3
Beds
3
Baths
1,318
Sq Ft
$590/Sq Ft
Est. Value
About This Home
This home is located at 3838 Saint James Cir, Baldwin Park, CA 91706 and is currently estimated at $777,668, approximately $590 per square foot. 3838 Saint James Cir is a home located in Los Angeles County with nearby schools including Kenmore Elementary, Sierra Vista Middle School, and Sierra Vista High.
Ownership History
Date
Name
Owned For
Owner Type
Purchase Details
Closed on
Feb 12, 2024
Sold by
Quinones Edwin and Quinones Daisy C
Bought by
Edwin Quinones And Daisy C Quinones Revocable and Quinones
Current Estimated Value
Purchase Details
Closed on
May 22, 2003
Sold by
Quinones Daisy C and Quinones Edwin
Bought by
Quinones Edwin and Quinones Daisy C
Home Financials for this Owner
Home Financials are based on the most recent Mortgage that was taken out on this home.
Original Mortgage
$170,000
Interest Rate
5.71%
Mortgage Type
Purchase Money Mortgage
Purchase Details
Closed on
Nov 23, 1993
Sold by
Capistrano Basilio F and Capistrano Valentina B
Bought by
Quinones Daisy C and Quinones Edwin
Home Financials for this Owner
Home Financials are based on the most recent Mortgage that was taken out on this home.
Original Mortgage
$132,000
Interest Rate
7.38%
Create a Home Valuation Report for This Property
The Home Valuation Report is an in-depth analysis detailing your home's value as well as a comparison with similar homes in the area
Home Values in the Area
Average Home Value in this Area
Purchase History
| Date | Buyer | Sale Price | Title Company |
|---|---|---|---|
| Edwin Quinones And Daisy C Quinones Revocable | -- | None Listed On Document | |
| Quinones Edwin | -- | Chicago Title Co | |
| Quinones Daisy C | -- | Benefit Land Title Company |
Source: Public Records
Mortgage History
| Date | Status | Borrower | Loan Amount |
|---|---|---|---|
| Previous Owner | Quinones Edwin | $170,000 | |
| Previous Owner | Quinones Daisy C | $132,000 |
Source: Public Records
Tax History Compared to Growth
Tax History
| Year | Tax Paid | Tax Assessment Tax Assessment Total Assessment is a certain percentage of the fair market value that is determined by local assessors to be the total taxable value of land and additions on the property. | Land | Improvement |
|---|---|---|---|---|
| 2025 | $3,175 | $229,937 | $98,946 | $130,991 |
| 2024 | $3,175 | $225,429 | $97,006 | $128,423 |
| 2023 | $3,140 | $221,009 | $95,104 | $125,905 |
| 2022 | $3,188 | $216,677 | $93,240 | $123,437 |
| 2021 | $3,135 | $212,429 | $91,412 | $121,017 |
| 2019 | $2,953 | $206,130 | $88,701 | $117,429 |
| 2018 | $2,787 | $202,089 | $86,962 | $115,127 |
| 2016 | $2,617 | $194,243 | $83,586 | $110,657 |
| 2015 | $2,680 | $191,326 | $82,331 | $108,995 |
| 2014 | $2,646 | $187,579 | $80,719 | $106,860 |
Source: Public Records
Map
Nearby Homes
- 3843 Monterey Ave
- 13500 Ramona Pkwy
- 4008 Filhurst Ave
- 13655 Foster Ave Unit 2
- 3902 Bresee Ave Unit 14
- 3902 Bresee Ave Unit 1
- 3729 Baldwin Park Blvd
- 4244 Harlan Ave
- 3537 Maine Ave
- 3314 Baldwin Park Blvd
- 4000 Stewart Ave Unit 8
- 13522 Francisquito Ave Unit C
- 4031 La Rica Ave Unit O
- 3151 Paddy Ln
- 3425 Athol St
- 13721 Los Angeles St
- 13725 Los Angeles St Unit H
- 14043 Rockway Dr
- 13755 Los Angeles St Unit 5
- 4409 Merced Ave Unit 15
- 3840 Saint James Cir
- 3841 Saint James Cir
- 3842 Saint James Cir
- 3845 Saint James Cir
- 13442 Ramona Blvd
- 13442 Ramona Blvd
- 13426 Ramona Blvd
- 3832 Foster Ave
- 3842 Grace Ave
- 3836 Grace Ave
- 3817 Grace Ave
- 3846 Grace Ave
- 3816 Foster Ave
- 3850 Grace Ave
- 13414 Ramona Blvd
- 13443 Athol St
- 3813 Grace Ave
- 13437 Athol St
- 3834 Foster Ave
- 13502 Ramona Blvd